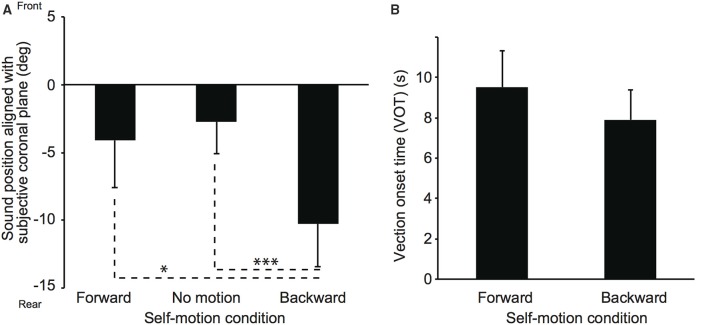
Figure 4.
Effect of constant velocity on auditory localization (A) and on vection onset latency (B) in Experiment 2. The simulated self-motion velocity was 1.5 m/s. Error bars denote standard errors. Note that the participants experienced self-motion perception but were not physically moved. *p < 0.05; ***p < 0.005.

