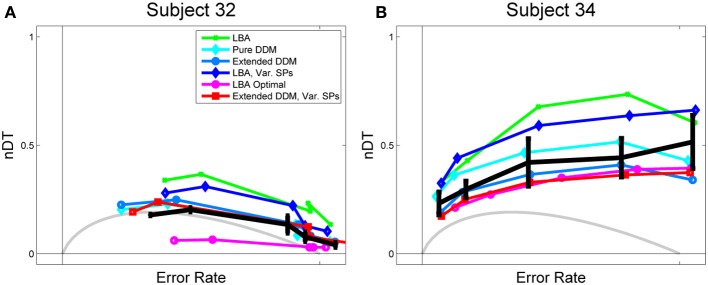
Figure 3.

Data and fits to Rmax behavior for (A) a high performing and (B) a low performing participant. Empirical normalized DTs, estimated from mean RT data for the main task and RTs from a signal detection task, are shown in black with standard error bars. OPC for the pure DDM is shown in gray, and OPCs for the LBA, computed as described in section 2.2.3, are shown in purple open circles. LBA fits, shown in green, overestimate normalized DTs for both subjects. The OPC for the LBA, however, lies significantly below the data for Subject 32, because this data requires a small starting point range A to get low DTs in difficult tasks, and a low A yields low DTs throughout.
