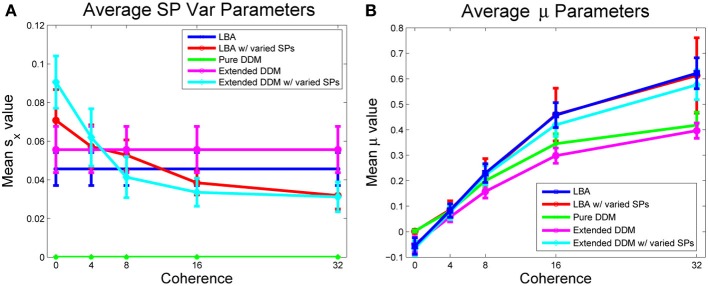
Figure 6.

(A) Mean values of the range of starting points sx, A, averaged over participants, by model and coherence condition (the pure DDM does not allow starting point variability). (B) Mean values of drift rate μ, averaged over all participants. For LBA model fits, the relative evidence in favor of option 1 is shown. Bars indicate standard errors for n = 17 subjects.
