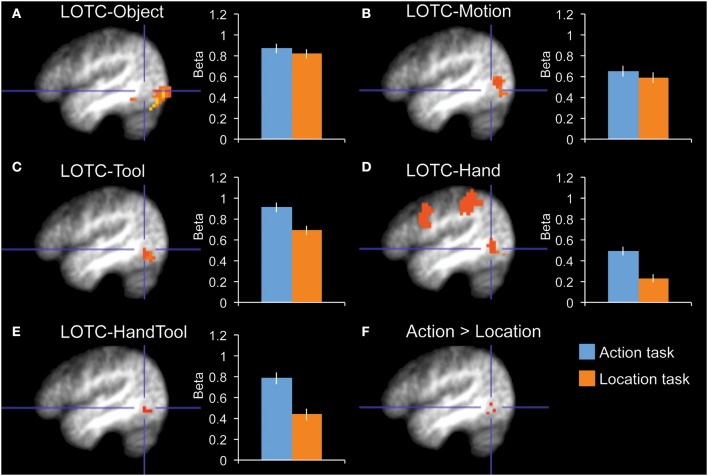
Figure 2.
fMRI results in functionally localized regions in left lateral occipitotemporal cortex. Bar graphs indicate mean activity (Beta weights) in the displayed ROIs during the action (blue) and location (orange) tasks of the main experiment. (A) LOTC-Object (intact > scrambled objects), (B) LOTC-Motion (moving > static dots), (C) LOTC-Tool (tools > animals), (D) LOTC-Hand (hands > animals), (E) LOTC-HandTool (tools > animals AND hands > animals), (F) the whole-brain group-average contrast action task > location task gave activity in left LOTC, overlapping with tool and hand-selective ROIs. All brain activity maps are shown at P < 0.005, displayed on the group-average anatomical scan, at x = −46. Blue crosshairs centered on action > location contrast (F) are added for spatial reference across panels. Error bars reflect within-subject s.e.m.

