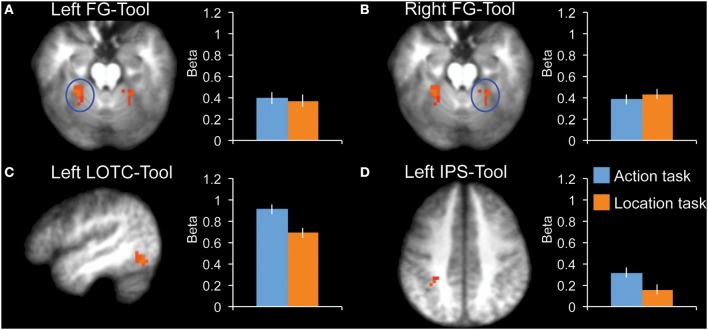
Figure 3.
fMRI results in tool-selective regions, localized by contrasting tools with animals. Bar graphs indicate mean activity (Beta weights) in the displayed ROIs during the action (blue) and location (orange) tasks of the main experiment. (A) Left FG-Tool (z = −18), (B) Right FG-Tool (z = −18), (C) left LOTC-Tool (x = −46), (D) Left IPS-Tool (z = 42). All brain activity maps are shown at P < 0.005, displayed on the group-average anatomical scan. Error bars reflect within-subject s.e.m.

