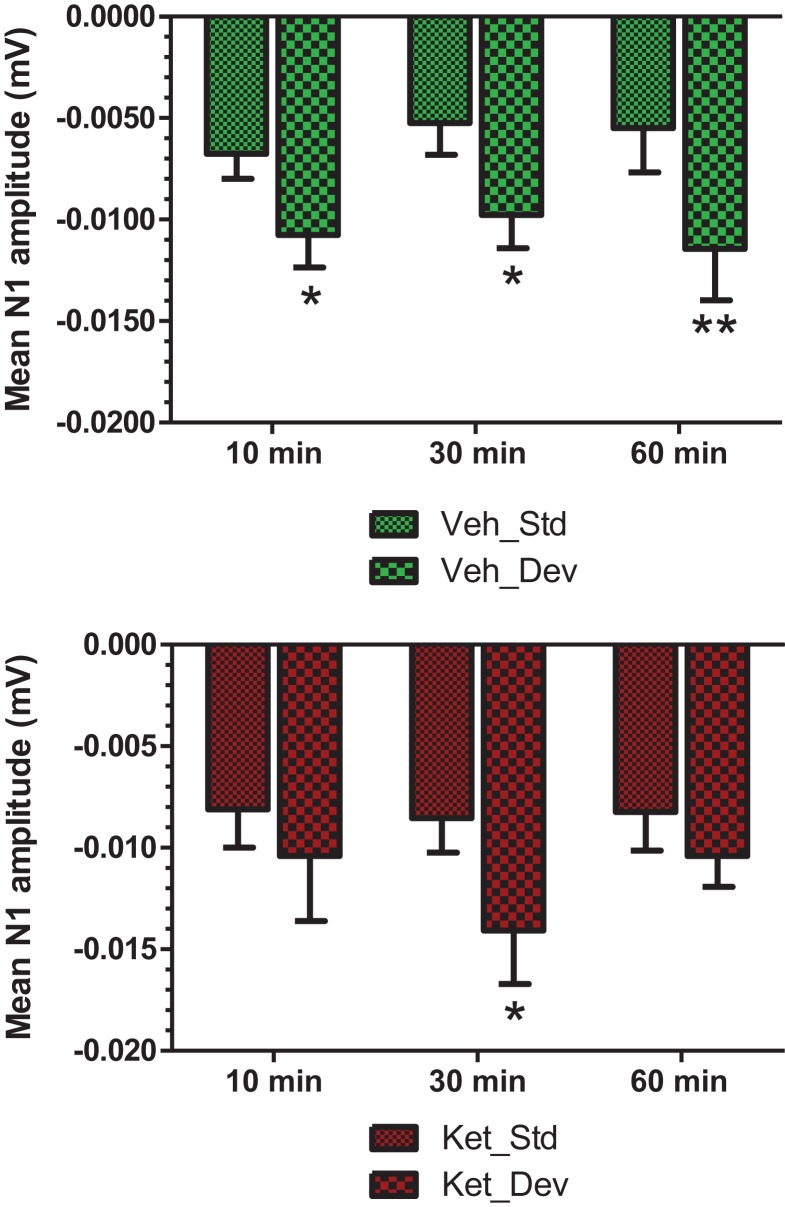
Figure 7.
Standard and deviant N1 amplitudes compared are shown. Top panel summarizes post-vehicle responses across three time points. Two-way ANOVA with repeated measures showed a robust effect of condition (standard or deviant) on N1 response [F(1) = 27.85; P < 0.0001]. Bottom panel shows post-ketamine data. A significant condition effect was noted [F(1) = 6.82; P = 0.012]. */**Indicate significant treatment effect (P < 0.05/0.01 respectively; Bonferroni post-tests).

