
Figure 4.
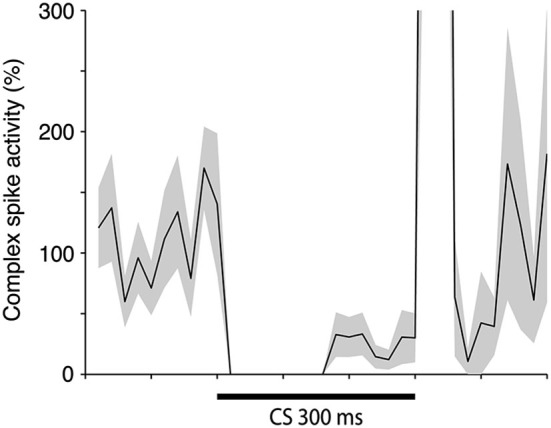
Complex spike activity during the CS when all trials with CS facilitated complex spikes has been excluded. Mean ± SEM of relative complex spike activity in 11 cells either at the end of acquisition (n = 7), or in the beginning of extinction (n = 4). One cell was excluded from this analysis because it displayed CS facilitated complex spikes on a high proportion of the trials.