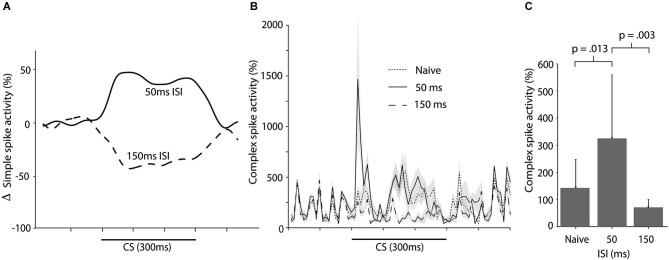
Figure 6.

Simple and complex spike activity following training with short ISIs. (A) Smoothed, mean change in simple spike firing rate as a result of training with either a 50 ms ISI or a 150 ms ISI. Figure adopted from Wetmore et al. (2014; Figure 3D). (B) Complex spike activity (mean ± SEM), during the CS in naïve cells (n = 15), cells trained with a 50 ms ISI (n = 11), and cells trained with a 150 ms ISI (n = 10) ISI. For each session the data was binned in 10 ms bins and then averaged over all trials. Activity is expressed as a percentage of the background activity, defined as the activity in the second preceding the CS onset. (C) Histogram illustrating the average complex spike frequency and standard deviation (error bars) in naïve cells and in cells trained with either a 50 ms or 150 ms ISI, in the first 100 ms of the CS.
