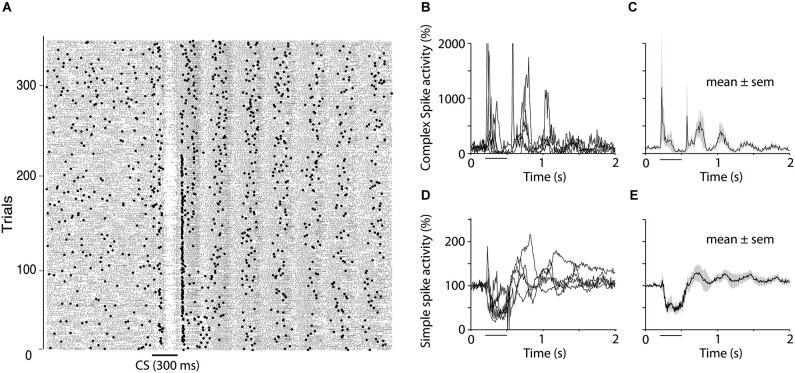
Figure 7.
Oscillations of simple and complex spike activity. (A) Raster plot showing simple spikes (small dots) and complex spikes (larger dots) in one Purkinje cell during extinction (CS alone presentations). The plot shows the rebound in both simple and complex spikes that often occurs following the complex spike suppression as well as the subsequent oscillations that were seen in 50% of the cells recorded. (B–E) Five cells, which, based on visual inspection of raster diagrams, showed clear oscillations after the CS. Four of these cells were recorded during extinction and one was recoded in the acquisition phase. (B and D) shows traces from individual cells for complex spikes and simple spikes respectively whereas (C and E) shows mean ± SEM of these five cells.

