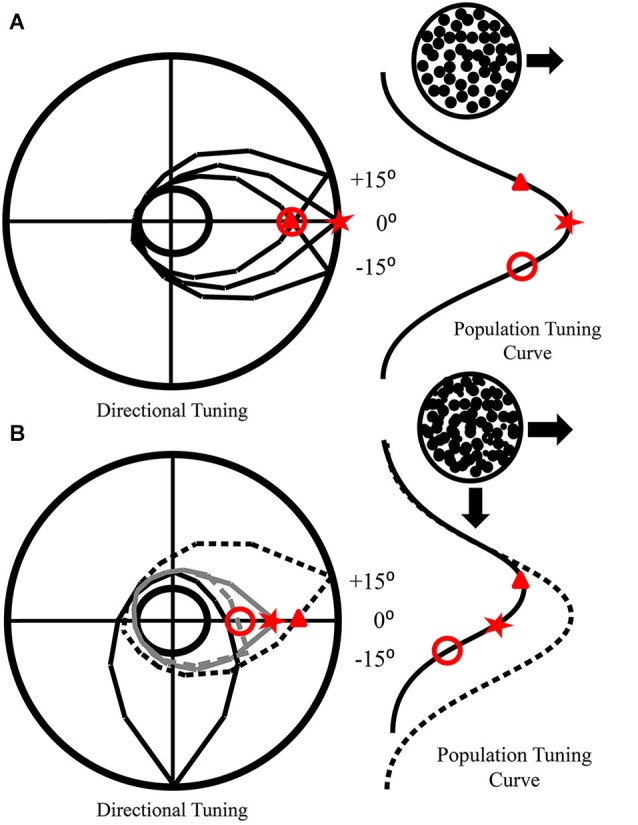
Figure 6.

How mutual inhibition produces direction repulsion. (A) Individual tuning curves of neurons preferring the direction of motion (0°) and nearby directions (±15°) are presented in the polar plot. The population tuning curve that arises from their responses to rightward motion is also depicted. (B) The addition of a second surface moving downwards produces inhibition of other directional neurons. This inhibition drops off as the difference in preferred directions increases. Hence, the −15° neuron is more strongly inhibited (gray dashes) than the 0° neuron (solid gray), while the +15° neuron (black dashes) is not inhibited. This produces a population tuning curve that is shifted away (solid black) from the real direction of motion (dotted line). As the inhibition is mutual, a similar shift would occur for neurons responding to downward motion.
