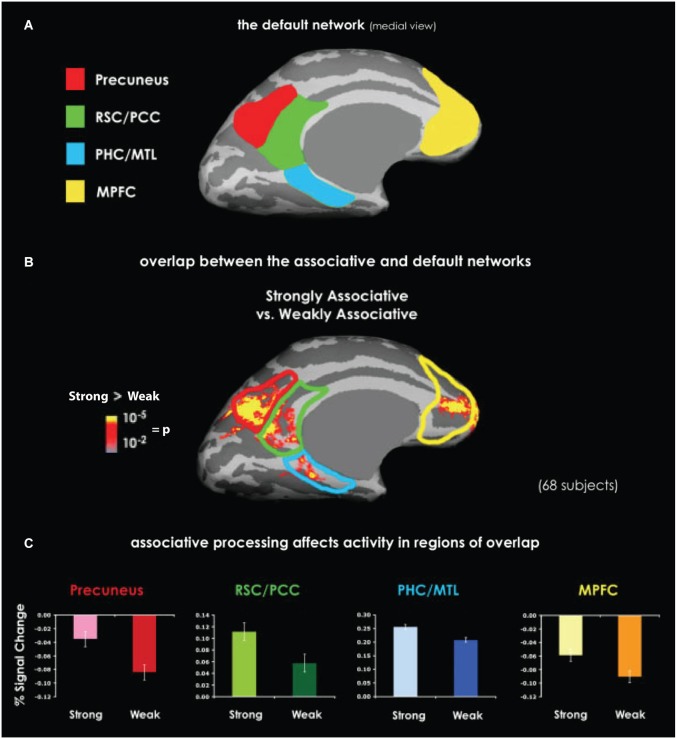
Figure 4.
Overlapping activation between the default network and the context association network. (A) Medial view of the default network. The labeled regions, including the RSC, are those that typically show greater BOLD activation during inter-trial rest than during task performance. (B) An activation map shows the difference between perceiving highly contextual objects (e.g., a shopping cart) and weakly contextual objects (e.g., a rope). Data were obtained by averaging together six similar experiments. The superimposed outlines of default network areas demonstrate the overlap between context processing and the default network. (C) Activity related to context processing in the regions of overlap with the default network, as manifested by percent of signal change. In each of these regions, highly contextual objects elicited either stronger positive or less negative activation compared with weakly contextual objects. Abbreviations: retrosplenial cortex (RSC), posterior cingulate cortex (PCC), parahippocampal cortex (PHC), medial temporal lobe (MTL), medial prefrontal cortex (MPFC). Adapted from Bar et al. (2007).

