Figure 4.
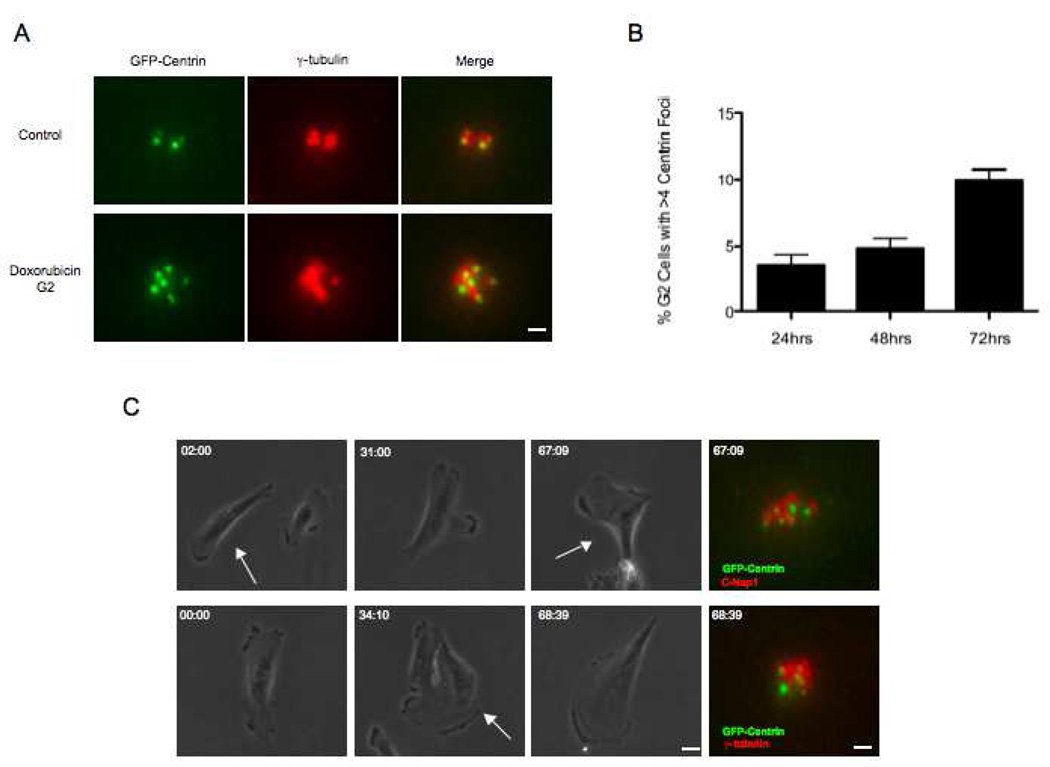
DNA damage leads to low levels of centriole reduplication during prolonged G2. (A) Representative images of centrioles in a control G2 cell and extra centrioles in a cell 48hrs after Doxorubicin. GFP-centrin (green), γ-tubulin (red). Scale bar=1µm. Images are maximum intensity point projections from Z series images. (B) Incidence of cells with more than four centrin foci colocalizing with γ-tubulin at 24, 48, and 72hrs after addition of Doxorubicin. Histogram bars indicate the average from at least 3 experiments with 200 cells counted for each condition. Error bars are one standard deviation. (C) Correlative phase contrast/immunofluorescence images of G2 arrested cells exhibiting more than four centrin foci colocalizing with γ-tubulin (upper panels) or C-Nap1 (lower panels). Phase contrast images were taken at 10X magnification and corresponding immunofluorescence images were acquired at 100X magnification. Arrows depict cell that was followed. GFP-centrin (green), γ-tubulin (red), C-Nap1 (red). Scale bars= 20µm and 1µm respectively. hr:min shown in upper left corner of each frame represents time after Doxorubicin pulse. Fluorescence images are maximum intensity point projections from Z series images.

