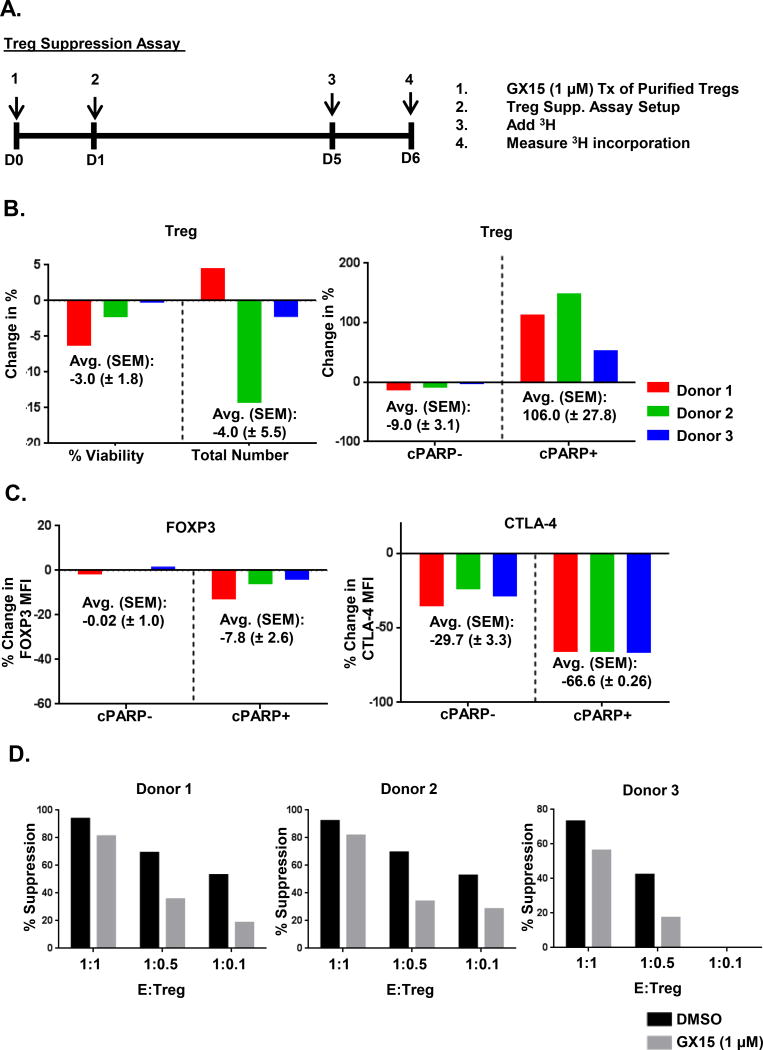
FIGURE 8.
The suppressive activity of Tregs is reduced after GX15 treatment. (A) Schematic outline of GX15 treatment of Tregs isolated from normal donor PBMCs (n=3). Purified Tregs were treated with 1.0 μM of GX15 for 24 h after which GX15-treated Tregs were washed, and then co-cultured with conventional CD4+ T cells for 4 d after which 3H was added for 24 h and then its incorporation was measured. (B) Bar graphs indicate the % change in viability and cell number and in cleaved PARP (cPARP) after GX15 treatment at 1.0 μM. Average and standard error of mean of the % change are also shown. (C) Bar graphs show the % change in mean fluorescence intensity (MFI) of FOXP3 and CTLA4 in cPARP+ and cPARP− Tregs. Average and standard error of mean of the % change are also shown. (D) Bar graphs indicate the suppressive activity of GX15-treated Tregs at various effector:Treg ratios.

