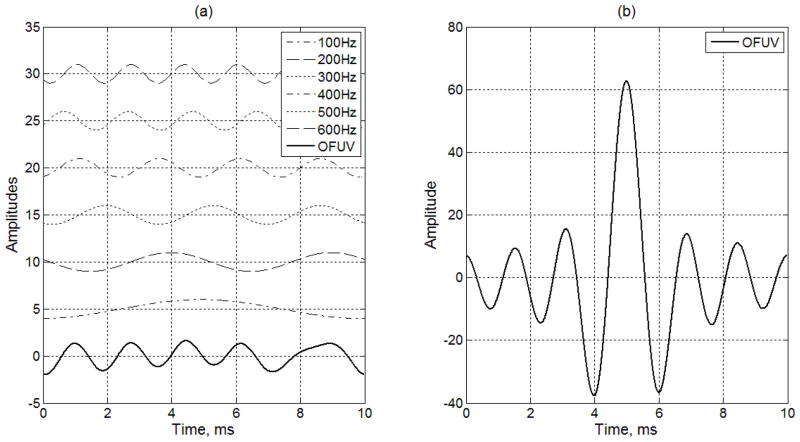
Fig. 4.
(a) Example of constructing an orthogonal frequency ultrasound vibration signal composed of frequency components at 100, 200, 300, 400, 500 and 600 Hz. Each of the vibration signals are offset for visualization purposes. The OFUV wave shown in the bottom is a sum of six harmonics shown in top six plots. (b) Another OFUV signal using alternating (π, 0) phases for different harmonics.

