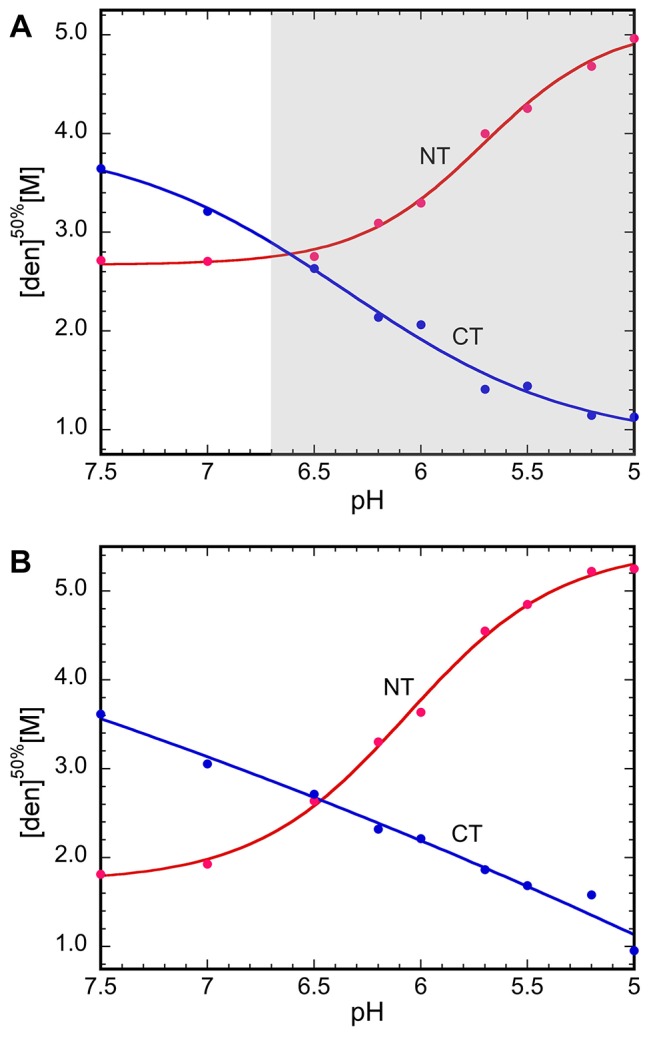
Figure 3. NT and CT respond differently to lowered pH.

Stability of NT and CT (from A. ventricosus) in (A) 20 mM HEPES/MES buffer with 154 mM NaCl and (B) the same buffer without NaCl, measured with Trp fluorescence and CD spectroscopy at 222 nm, respectively, presented as urea concentrations for apparent half-denaturation ([den]50%, see Materials and Methods for details on how [den]50% was determined) as a function of pH. The pH region in which CA activity is found in major ampullate glands is indicated by a shaded area in (A).
