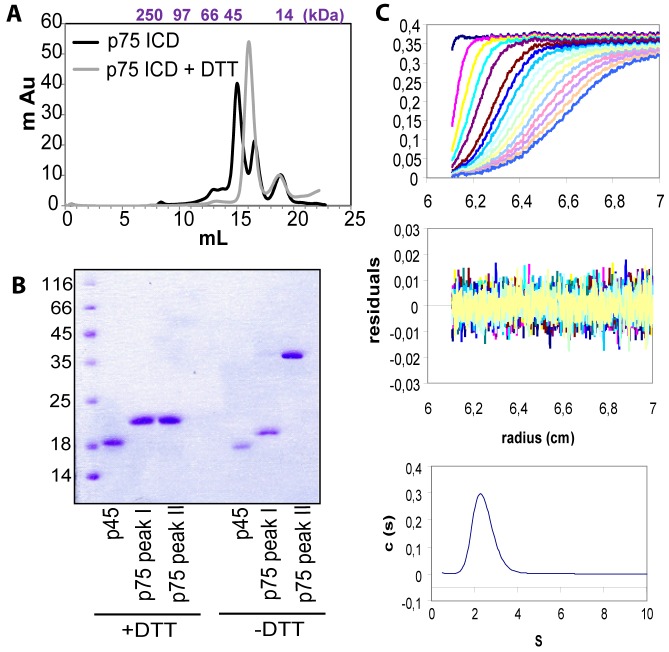
Figure 3. p75ICD homodimerization.
(A) Size exclusion gel-filtration chromatography of p75ICD. The elution profile reveals the presence of a mixture of monomers and dimers in the case of p75ICD (black lines). In the presence of DTT, only one elution peak in the gel filtration chromatogram is seen (gray line). Molecular weight standards are shown above the chromatogram. (B) Coomassie blue staining of reducing and nonreducing SDS-PAGE of the fractions collected in gel filtration as shown in (A). The presence of a protein band corresponding to a p75ICD dimer in the nonreducing SDS-PAGE is shown with an arrowhead. The migration of p45ICD is shown as a reference. (C) Analytical ultracentrifugation data on p75ICD in PBS (pH 8.0). (Top) Overlay of successive sedimentation velocity profiles recorded at ∼10 min intervals, represented by different colors. The solid lines represent the direct fitting of the data to a two-species model by the Svedberg program. (Bottom) Sedimentation velocity AUC profiles and the c(S) distributions for p75ICD (at 0.1, 0.3, and 1.0 mg ml−1). The residual differences between the experimental data and the fit for each point are shown above. Theoretical p75ICD MW = 16.5 kDa. Fitting data MW = 30.7±1.2 kDa.

