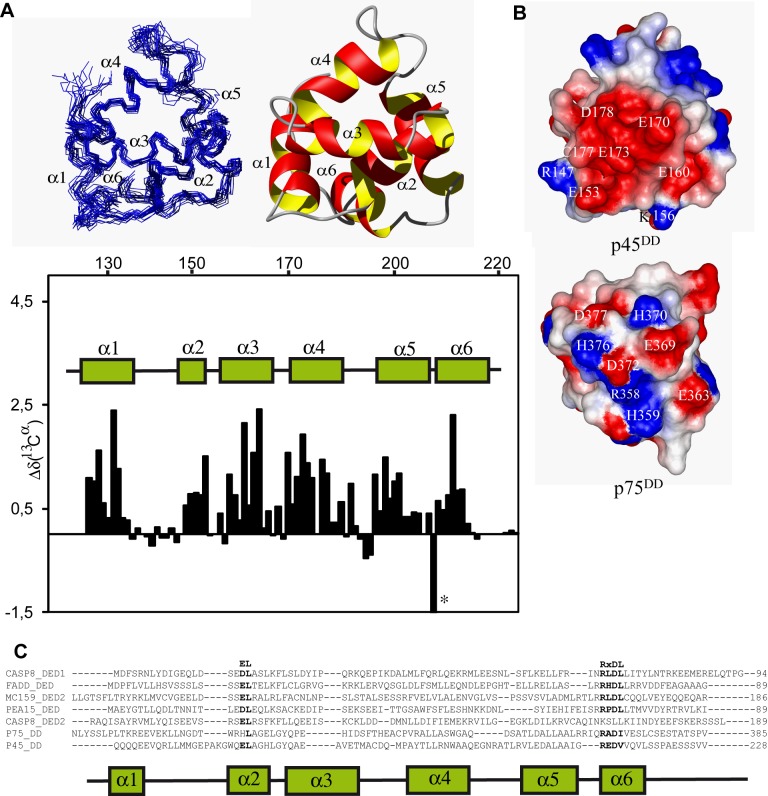
Figure 6. Three-dimensional NMR structure of p45DD.
(A) Superposition of 20 conformers representing the 3D NMR structure (left) and ribbon diagram of the lowest energy conformer highlighting the α-helices in red and yellow (right). (Bottom) 13Cα chemical shift deviation from their corresponding "random coil" values Δδ(13Cα) of p45ICD (residues 130–228). Segments of positive deviations are indicative of helical secondary structure. The location of the six α-helices of p45 are represented by cylinders and labeled accordingly. The asterisk indicates the unusual chemical shift of R211 attributed to the salt bridge between R211 and D213 as well as E160. (B) Electrostatic potential of p45DD and p75DD in a surface representation indicates a highly negative patch around helix α3 of p45DD. The same orientation as in (A) is used. (C) Sequence alignment of DEDs of mouse PEA-15 (Q62048), human FADD-DED (Q13158), human Caspase-8 (Q14790), molluscum contagiosum virus MCV-159 (Q98325), and death domain from rat p75DD (NP_036742) and mouse p45DD (NP_080288). The positions of helices are indicated by the diagram below the p45DD sequence. The conserved motif RxDΦ at the beginning of helix 6 and the conserved residues (EL) in helix 2 are indicated in bold.

