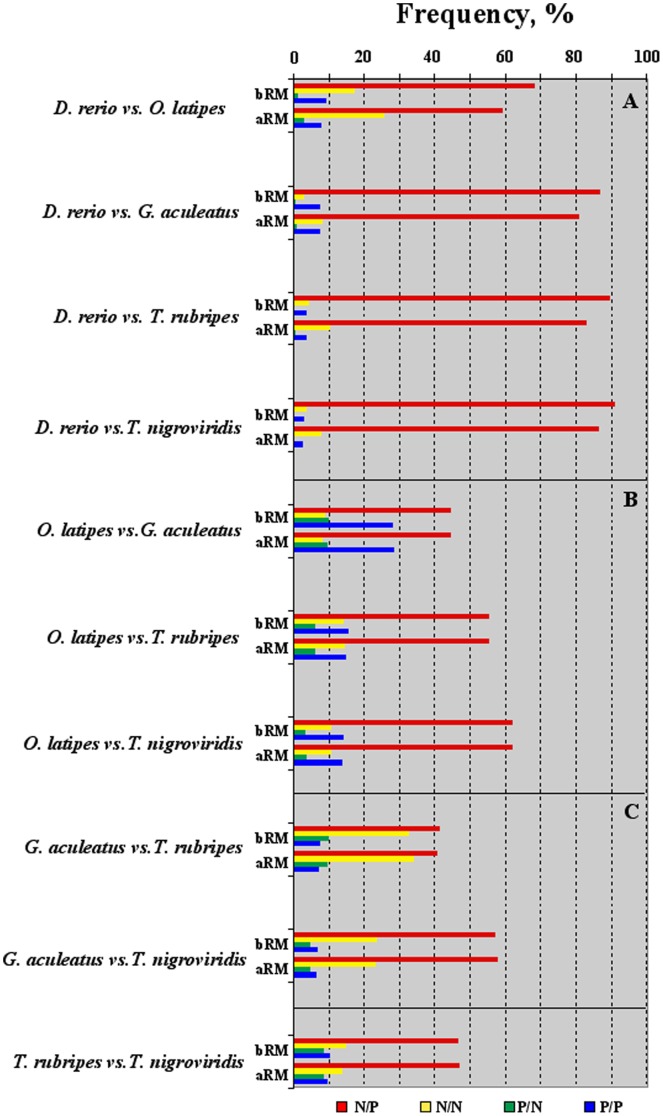
Figure 4. The histogram shows the percent of the four classes N/P (negative Δbpi and positive ΔGCi values), N/N (negative Δbpi and negative ΔGCi values), P/N (positive Δbpi and negative ΔGCi values) and P/P (negative Δbpi and negative ΔGCi values) in each pairwise genome comparisons.
Data before (bRM) and after (aRM) RepeatMasker are reported. Clusters A, B and C as in the legend of Fig. 2.

