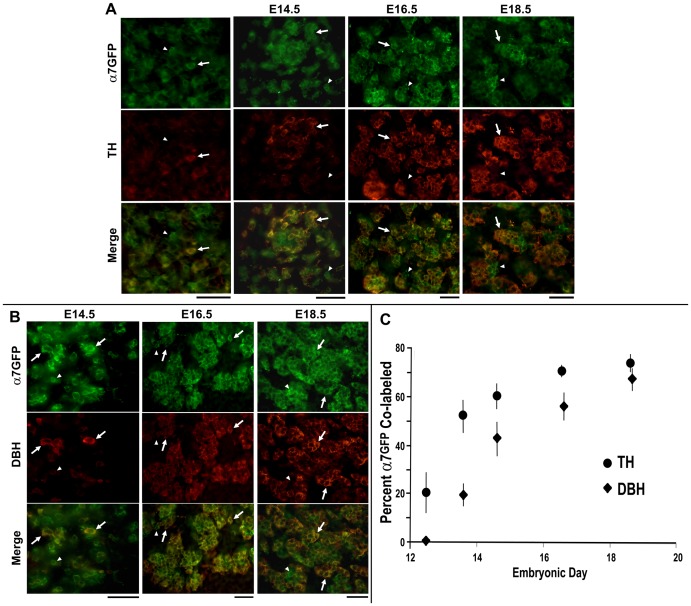
Figure 3. Coincident appearance of α7G and catecholamine markers during chromaffin cell development.
The adrenal glands from α7G mice at the E12.5, E14.5, E16.5 and E18.5 developmental stages were co-stained for immunoreactivity to GFP (green) and in red either (A) tyrosine hydroxylase (TH) or (B) dopamine-beta-hydroxylase (DBH). C. Quantification of the α7G cells co-labeled with either TH or DBH for the developmental stages. For each point at least 3–5 sections from the adrenal glands were collected from 3–6 different animals and the results from each individual animal were then summarized. The error bars reflect +/− standard error of the mean. Scale bar = 25 µm (E12.5, E14.5) or 50 µm (E16.5, E18.5).

