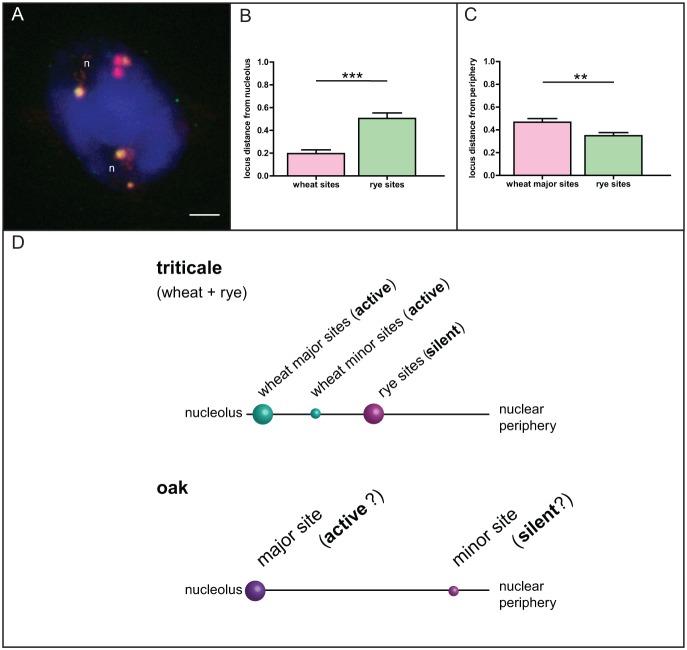
Figure 4. Correlation between the position of a NOR locus relative to the nucleolus and its transcriptional activity.
A. Locations of wheat (yellow-green) and rye (red) NOR loci in nuclei of triticale revealed by FISH. Statistical analysis of measured distances from the nucleolus (B, N = 42) or the nuclear periphery (C, N = 42) revealed significant differences between wheat and rye rDNA loci, concordant with the established transcriptional activity of the wheat loci and silencing of the rye locus due to nucleolar dominance. Number of asterisks indicates p<0.01 (**) and p<0.0001 (***); error bars represent the standard error of the mean. D. The graphical illustration of the correlation between the position of a NOR locus in relation to the nucleolus and its transcriptional activity in triticale and the common oak. Letter “n” marks the nucleoli. Scale bar is 5 µm.

