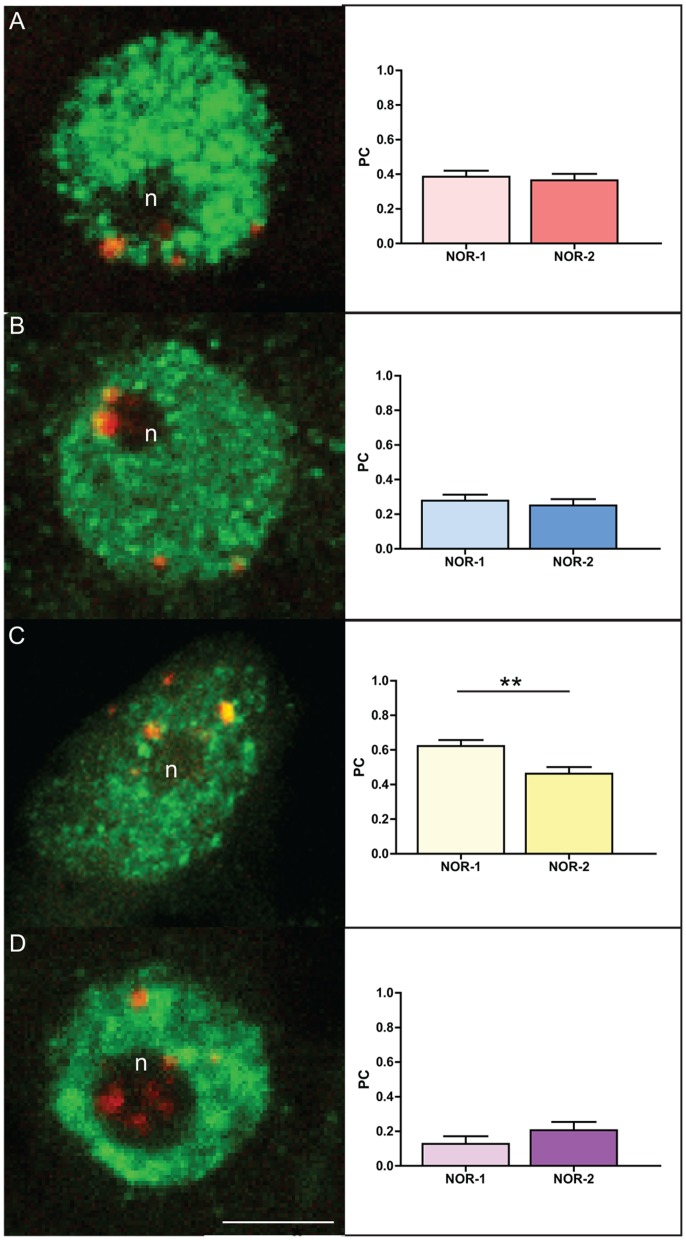
Figure 9. Histone modifications associated with NOR-1 and NOR-2 loci in root tip cycling cells of Q. robur after treatment 5-aza-2′-dC.
IFF detection of H3K9ac (A), H3K4me3 (B), H3K9me1 (C) and H3K27me2 (D) and graphs showing Pearson’s coefficient of co-localization of respective histone marks with the NOR loci. Green signals correspond to immunofluorescence of histone antibodies and red signals represent 18S rDNA FISH signals. Number of asterisks indicates p<0.01; error bars represent the standard error of the mean. Letter “n” marks the nucleoli. Scale bar is 5 µm.

