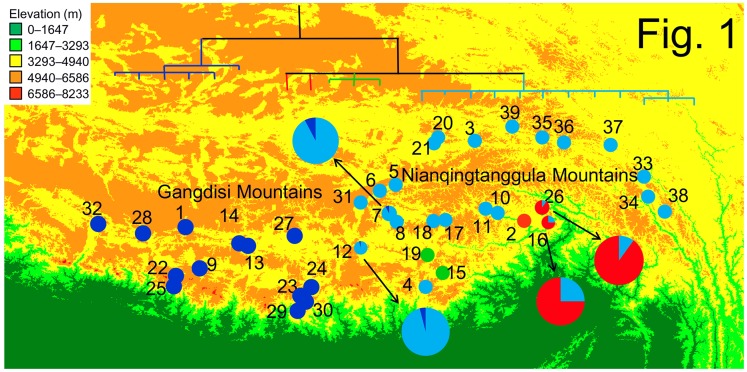
Figure 1. Sampling sites and the maternal genealogy based on mtDNA sequence data.
Site numbers refer to Table S1. Colors of the matrilines match those of samplings localities on the map. Four localities containing two matrilines each are show in larger pie figures.

