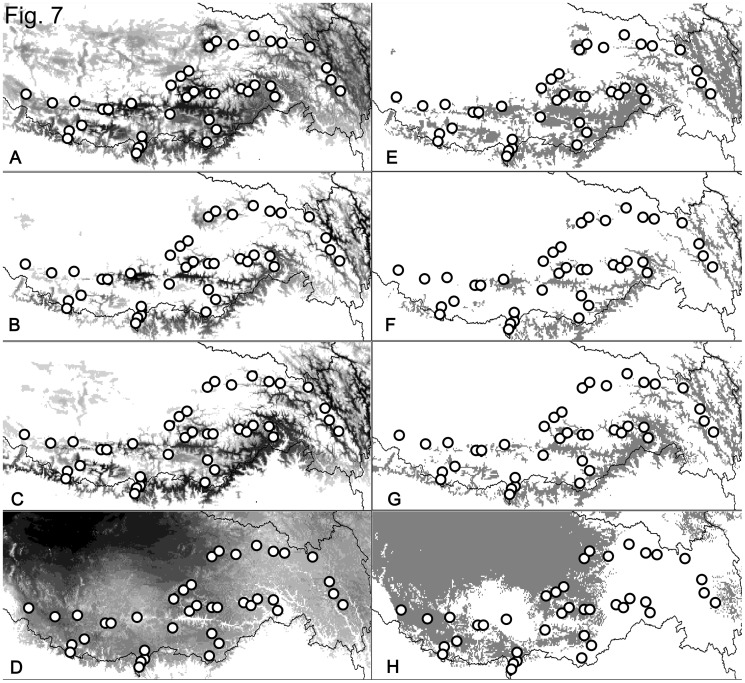
Figure 7. The predicted distribution of Nanorana parkeri.
A: predicted distribution based on current data; B: distribution during the LGM based on MIROC model; C: distribution during the LGM based on CCSM model; D: the predicted distribution in the 2080 s under GCC; E–H: predicted distributions above the threshold for models A–D, respectively.

