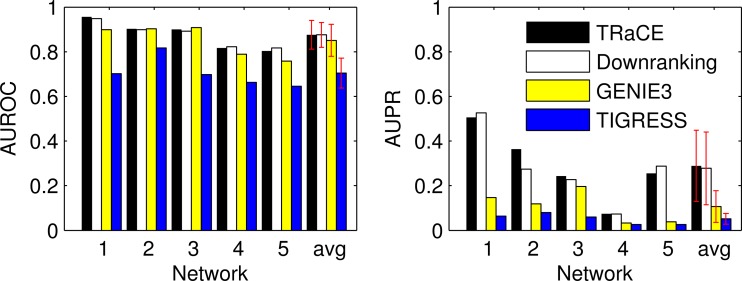
Figure 9. Comparison of TRaCE and top performing methods in DREAM4 100-gene network inference subchallenge: single-gene KO dataset.
The error bars represent the standard deviations. Based on the AUROC values, TRaCE performed as well as the downranking method ( ) and GENIE3 (
 ), but better than TIGRESS (
 ). Based on the AUPR values, TRaCE performed as well as the downranking method (
 ), but better than GENIE3 (
 ) and TIGRESS (
 ). The statistical significance was evaluated using two sample t-test.

