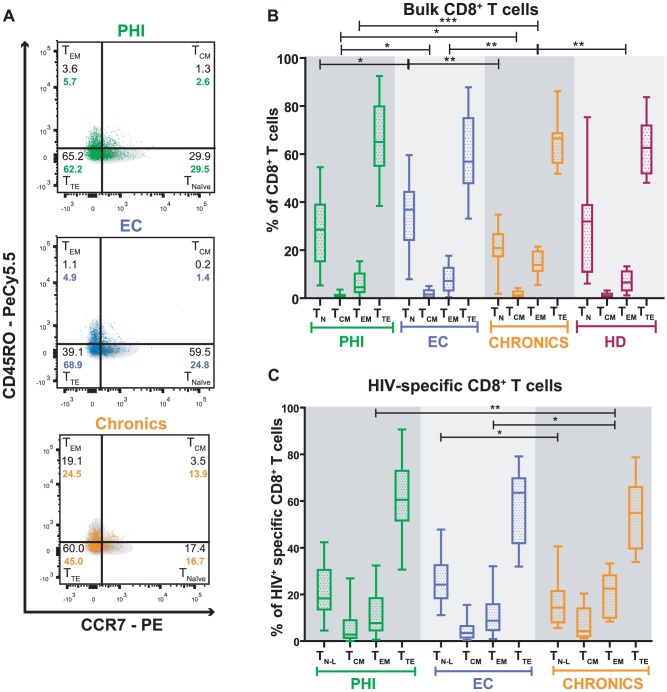
Figure 1. Distribution of memory sub-populations within bulk and HIV-specific CD8+ T-cells.
(A) Density and overlay dot plots of memory subsets in total (density) and HIV-specific CD8+ T-cells (colored dots) of one representative subject per study group. The four defined sub-populations are identified within each quadrant: TN and TN-L = Naïve and Naïve-like T-cells, respectively (CCR7+/CD45RO−); TCM = central memory T-cells (CCR7+/CD45RO+); TEM = effector memory T-cells (CCR7−/CD45RO+); TTE = terminal effectors T-cells (CCR7−/CD45RO−). Proportions of each memory subset of total (in black) and HIV-specific (in color) CD8+ T-cells are also shown. Panels B and C: Percentage of bulk (B) and HIV-specific (C) CD8+ T-cells subsets of subjects enrolled per study group. Primary HIV infection (PHI) N = 24 subjects (31 specific responses); Elite Controllers (EC) N = 11 subjects (16 specific responses); Chronics N = 10 subjects (13 specific responses); Healthy Donors (HD) N = 10. Horizontal lines stand for median values. P values were calculated using Mann-Whitney test. Asterisks denote different P values: * P<0.05; ** P<0.005; *** P<0.001.

