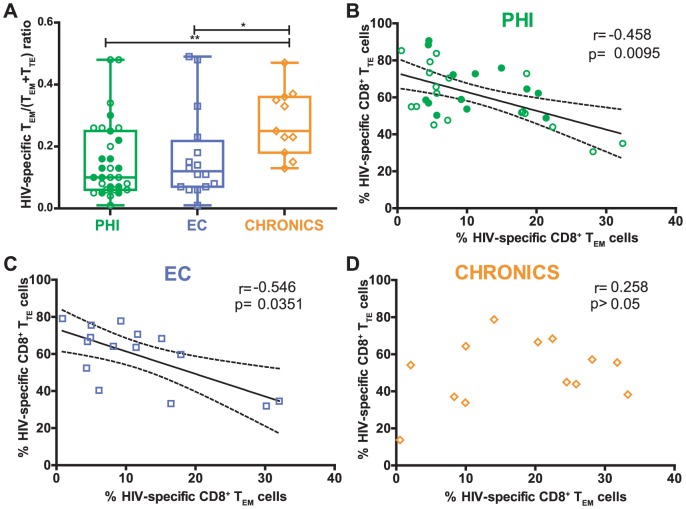
Figure 2. Arrest of HIV-specific CD8+ T-cells from effector memory (TEM) to terminal effector (TTE) of subjects enrolled.
HIV-specific TEM/(TEM+TTE) ratio (A) of subjects enrolled per study group. Correlation among HIV-specific CD8+ TTE and the TEM cells in primary HIV infection (PHI) (B), elite controllers (EC) (C) and Chronic (D) groups. PHI group N = 24 subjects (31 specific responses); EC N = 11 subjects (16 specific responses); Chronics N = 10 subjects (13 specific responses). Panels A and B, open and filled green dots denote PHI>350 and PHI<350 subjects, respectively. Panel A, P values were calculated using Mann-Whitney test. Asterisks denote different P values: * P<0.05; ** P<0.005. Panels B–D, r and P values correspond to Spearman's test.

