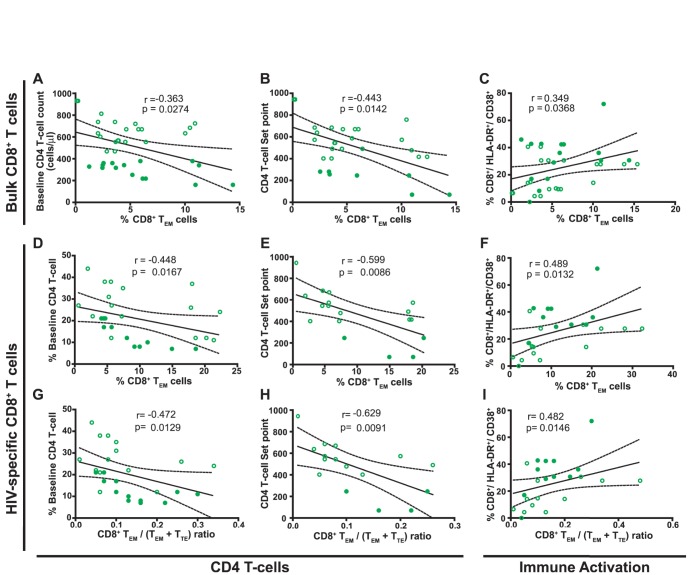
Figure 3. Correlations between the proportion of CD8+ TEM cells within bulk (A–C) and HIV-specific (D–F) compartments as well as the HIV-specific CD8+ TEM/(TEM+TTE) ratio (G–I) with clinical parameters measured in baseline samples from primary HIV infected (PHI) subjects.
Baseline CD4 T-cell counts (A), immune set point (B) and baseline immune activation (C) versus proportion of bulk CD8+ effector memory (TEM) cells. Percentage of baseline CD4 T-cell (D), immune set point (E) and baseline immune activation (F) versus proportion of HIV-specific CD8+ TEM cells. Percentage of baseline CD4 T-cell (G), immune set point (H) and baseline immune activation (I) versus HIV-specific CD8+ TEM/(TEM+TTE) ratio. PHI group N = 24 subjects (39 responses analyzed for bulk compartment and 31 responses for the specific compartment). For set point correlations N = 15 subjects. In all panels, open and filled green dots denote PHI>350 and PHI<350 subjects, respectively. All r and P values correspond to Spearman's test.

