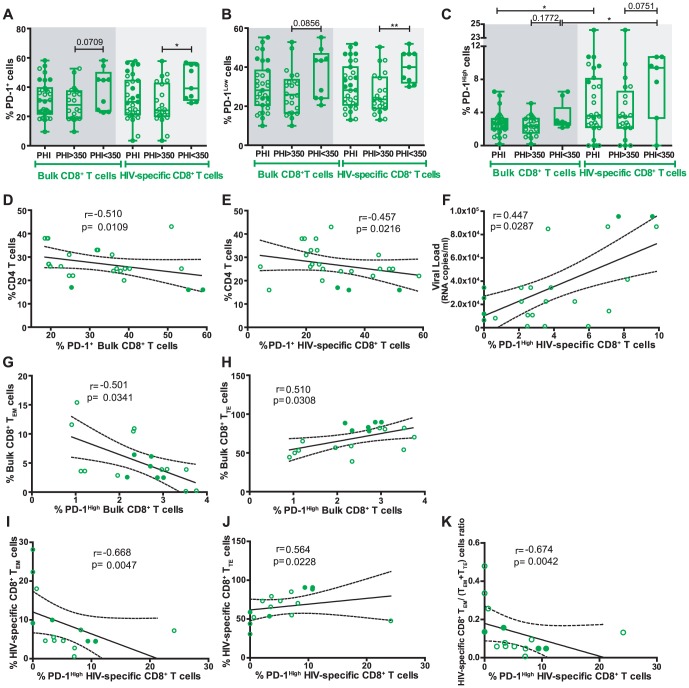
Figure 4. The relationship between PD-1 expression and markers of disease progression as well as with the distribution of memory subsets were studied in primary HIV infection (PHI) group.
Percentage of PD-1 (A), PD-1Low (B), and PD-1High (C) cells out of bulk and HIV-specific CD8+ T-cells, in samples from PHI subjects (N = 19; 30 specific responses) obtained at 8 months post-infection. (D to F) Correlations between clinical parameters and percentage of PD-1 expression in the CD8+ T-cell subset, within the PHI group: Percentage of CD4 T-cells versus percentage of bulk PD-1+ CD8+ T-cells (D) or PD-1+ HIV-specific CD8+ T-cells (E). Viral load versus percentage of PD-1High HIV-specific CD8+ T-cells (F). (G to K) Correlation between baseline CD8+ T-cell memory subsets and percentage of PD-1 expression at 8 months post-infection (N = 11 subjects; 18 specific responses): percentage of bulk CD8+ effector memory (TEM) (G) or terminal effector (TTE) (H) cells versus percentage of bulk PD-1High CD8+ T-cells. Percentage of HIV-specific CD8+ TEM (I), CD8+ TTE (J) cells, or TEM/(TEM+TTE) ratio (K) versus percentage of PD-1High HIV-specific CD8+ T-cells. Panels A–C: horizontal lines stand for median values. P values were calculated using Mann-Whitney test. Asterisks denote different P values: * P<0.05; ** P<0.005; *** P<0.001. Panels D–K: r and P values correspond to Spearman's test. In all panels, open and filled green dots denote PHI>350 and PHI<350 subjects, respectively.

