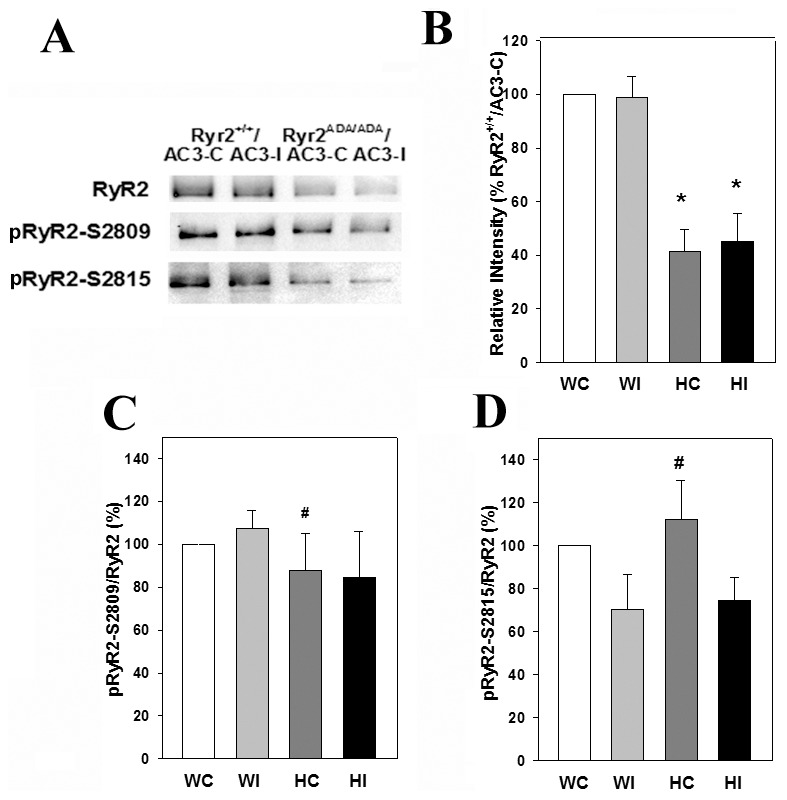
Figure 5. RyR2 phosphorylation on Ser-2809 and Ser-2815 in heart homogenates.

(A) Immunoblots of RyR2, pRyR2-S2809 and pRyR2-S2815 of heart homogenates from 10-day old Ryr2+/+/AC3-C (WC) and/AC3-I (WI) and Ryr2ADA/ADA/AC3-C (HC) and/AC3-I (HI) mice. Equal amounts of proteins (20 µg) were loaded on gels. (B) Intensity of RyR2 protein bands normalized for Ryr2+/+/AC3-C protein band intensities. (C and D) pRyR2/RyR2 on S2809 and S2815, respectively. Data were obtained analyzing proteins from 4–6 hearts of each genotype and are the mean ± SEM of 13 (B), 4 (C) and 5–7 (D) determinations using two way ANOVA. *p<0.05 compared with WC and WI. #p<0.05 compared with HC in blot of total RyR2 shown in B.
