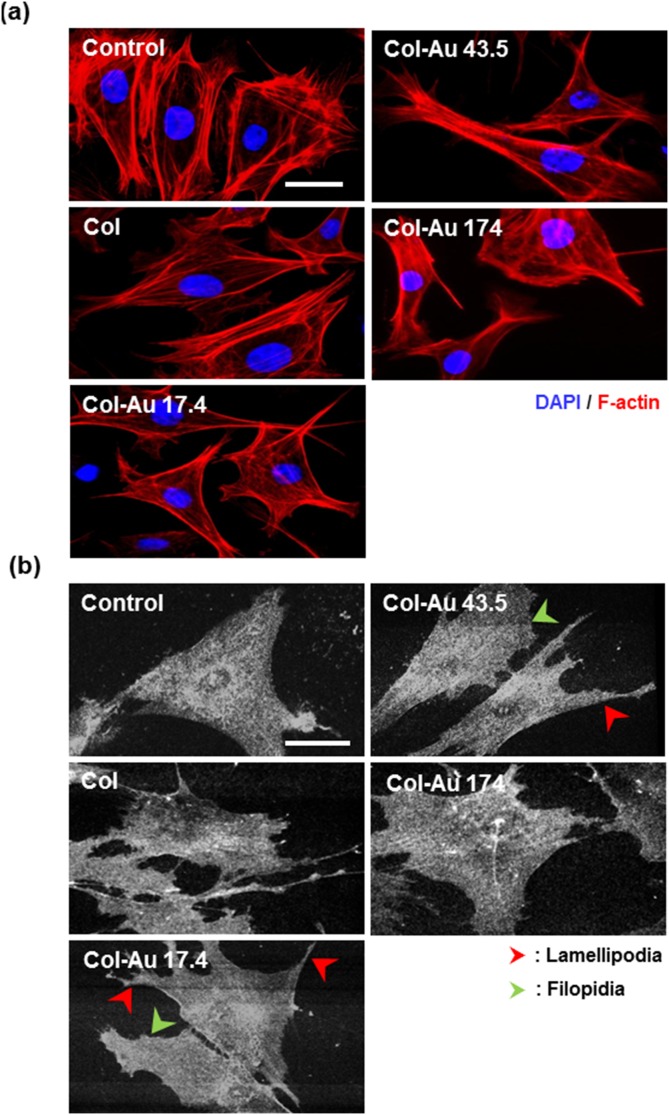
Figure 3. Cytoskeleton and cell morphology.
(a) Rhodamine phalloidin staining for the cytoskeletal fibers of MSCs on pure Col and different Col-Au nanocomposites at 8 h and 48 h by fluorescence microscopy. Scale bar = 50 µm. (b) SEM images for MSCs on pure Col and different Col-Au nanocomposites at 48 h. Arrows indicate filopodia (green color) and lamellipodia (red color). Scale bar = 50 µm.

