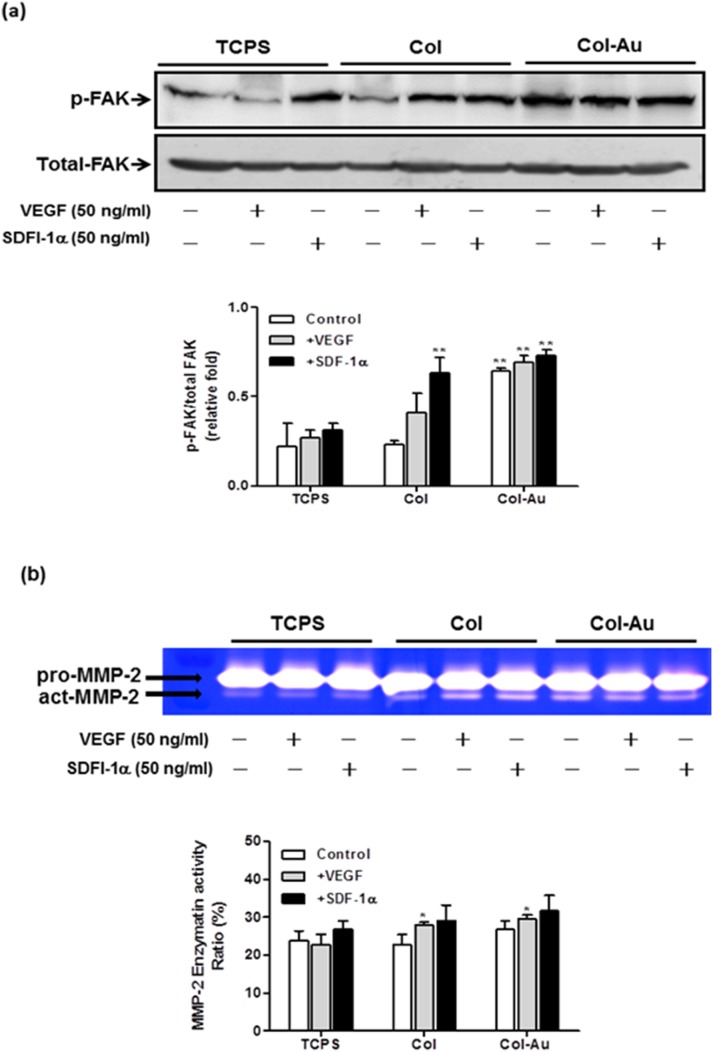
Figure 9. The expression of p-FAK protein and MMP-2 enzymatic activity in MSCs cultured on different materials for 48 h.
(a) Relative expression ratios of p-FAK was normalized to total FAK. **p<0.01. (b) The MMP-2 enzymatic activities was normalized to the protein content. Semi-quantitative measurement of the optical density (OD) of gelatinolytic bands revealed significantly greater MMP-2 expression for MSCs on Col-Au 43.5 ppm. *p<0.05: greater than control (TCPS).

