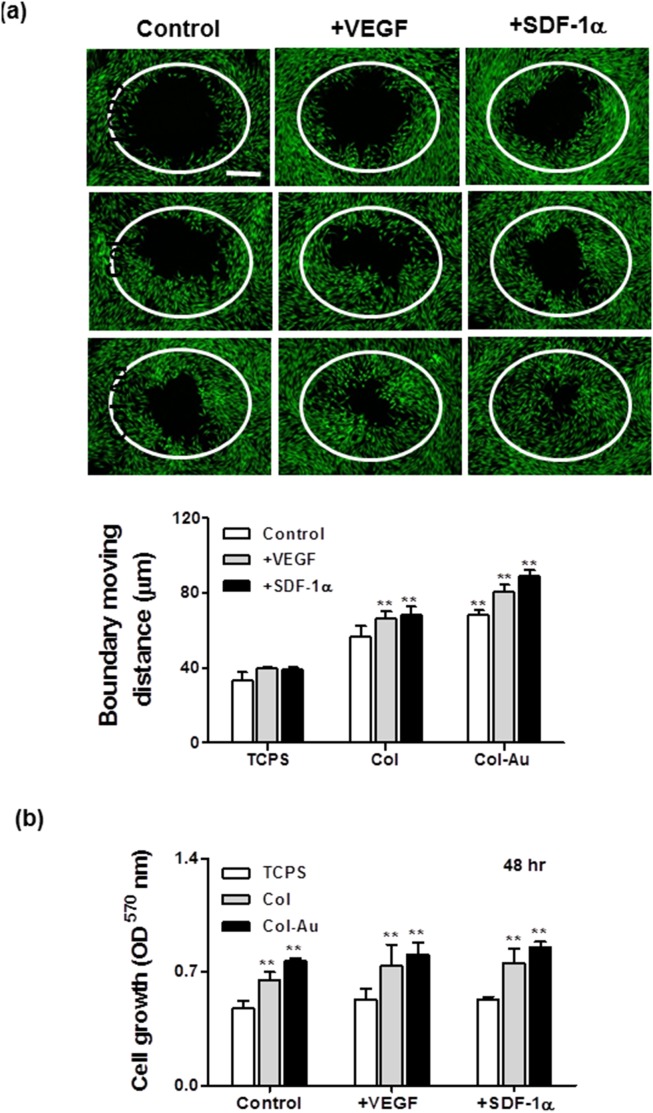
Figure 11. Migration of MSCs on different materials during a period of 48 h.
(a) Cell migration into the gap zone area was monitored by fluorescence microscopy. Cells were stained by calcein-AM (2 µM) prior to examination. Scale bar = 500 µm. **p<0.01: greater than control (TCPS). (b) MSCs proliferation examined by MTT assay. **p<0.01: greater than control (TCPS).

