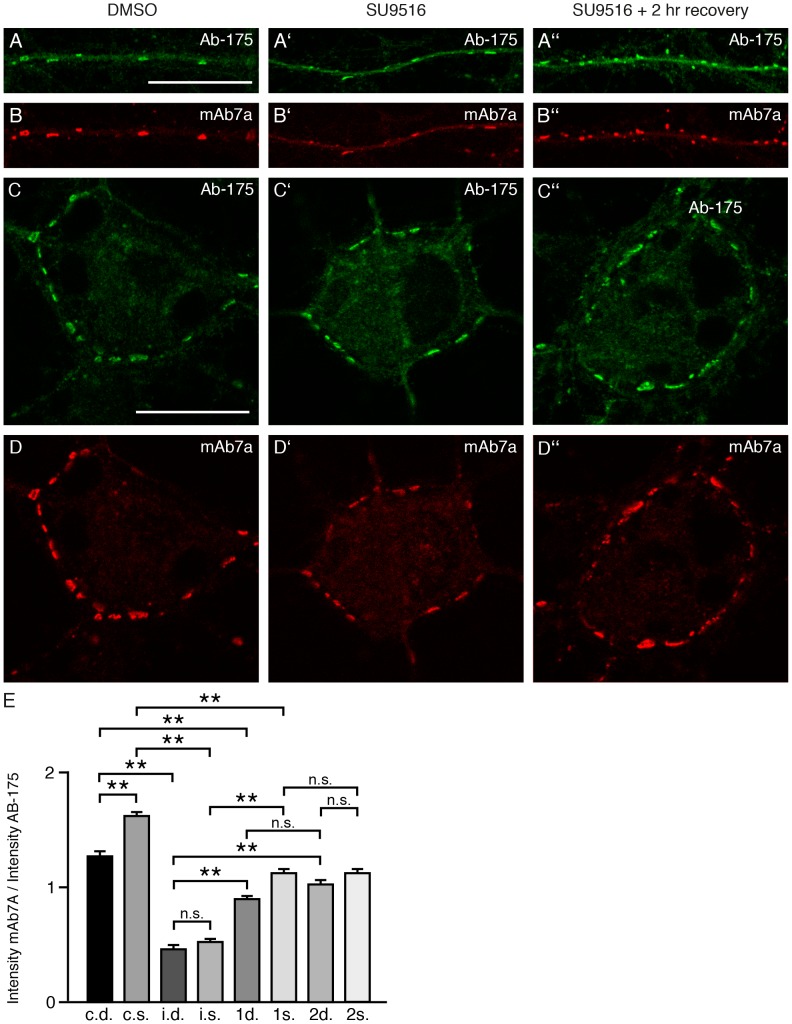
Figure 6. S270 phosphorylation is different at different synapses.
Relative fluorescence intensities of double labelling experiments using the pan-gephyrin antibody Ab-175 and the phospho-specific antibody mAb7a were measured in focal planes of confocal microscopy images. (A) Focal plane showing dendritic gephyrin clusters detected with Ab-175 or (B) with the phospho-specific mAb7a antibody. The scale bar represents 10 µm. (A′, B′, E) Upon treatment with CDK5 inhibitor SU9516 (5 µM) for six hours the phosphorylation of gephyrin is significantly reduced. (A′′) After replacement of medium with SU9516 by conditioned medium without inhibitor, cells were fixed and stained after a “recovery” time of two hours. Note increasing phosphorylation as indicated by mAb7a staining seen in B′′ compared to B′. The same analysis in C, C′, C′′ and D′, D′′, D′′ for “somatic” gephyrin clusters, revealing decrease and increase of gephyrin phosphorylation upon SU9516 treatment and “recovery”, respectively (D′′ compared to D′). (E) Quantification of mAb7a-specific phosphorylation comparing the fluorescence intensities of single clusters stained with mAb7a and Ab175 (ratios). c.d.: control dendritic clusters; c.s.: control somatic clusters; i.d.: CDK5 inhibitor treatment for 6 h, dentritic clusters h, dentritic clusters; i.s.: CDK5 inhibitor treatment for 6 h, somatic clusters h, somatic clusters; 1d: 1 hour recovery from inhibition, dendritic clusters hour recovery from inhibition, dendritic clusters; 1s: 1 hour recovery from inhibition, somatic clusters hour recovery from inhibition, somatic clusters; 2d: 2 hour recovery from inhibition, dendritic clusters hour recovery from inhibition, dendritic clusters; 2s: 2 hour recovery from inhibition, somatic clusters. Quantification was done with 660 clusters (total) from nine cells from three (n = 3) independent cultures. Mean ± SE. ANOVA with post-hoc test: ** P<0.01.

