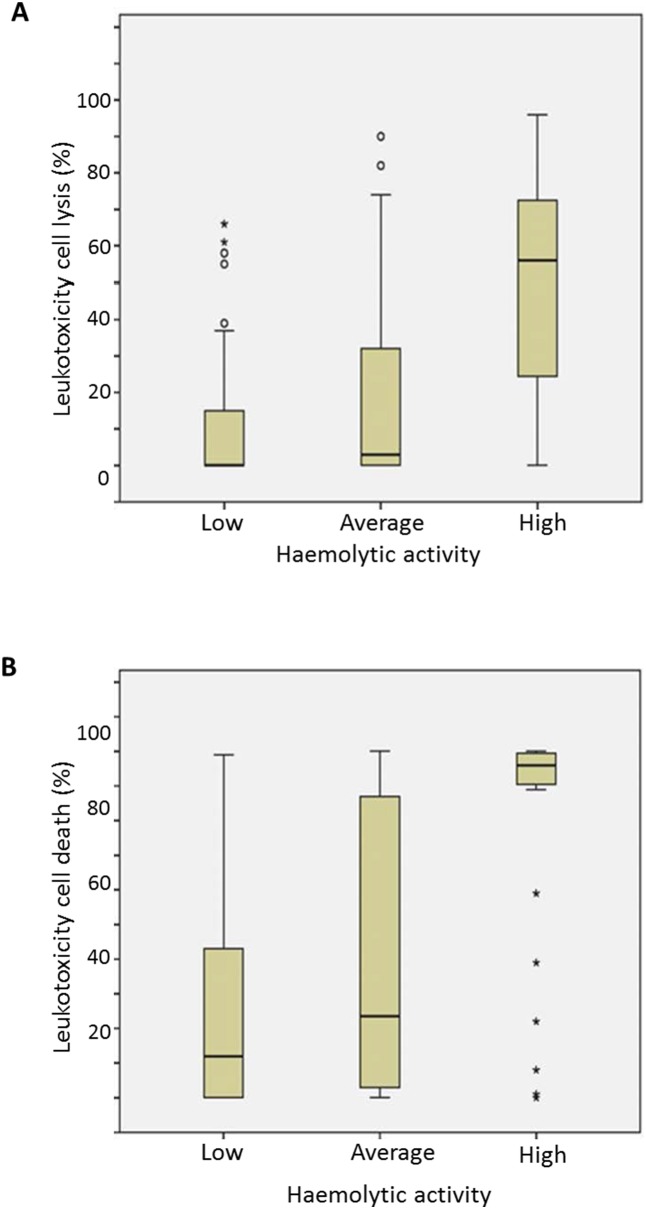
Figure 3. Distribution of A. actinomycetemcomitans isolates into three categories (minimal, average, high) according to leukotoxicity (n = 239).
A. Correlation between the cell lysis (LDH) method and the haemolysis method. B. Correlation between the cell death (NRU) method and the haemolysis method.

