. 2014 Aug 5;9(8):e104081. doi: 10.1371/journal.pone.0104081

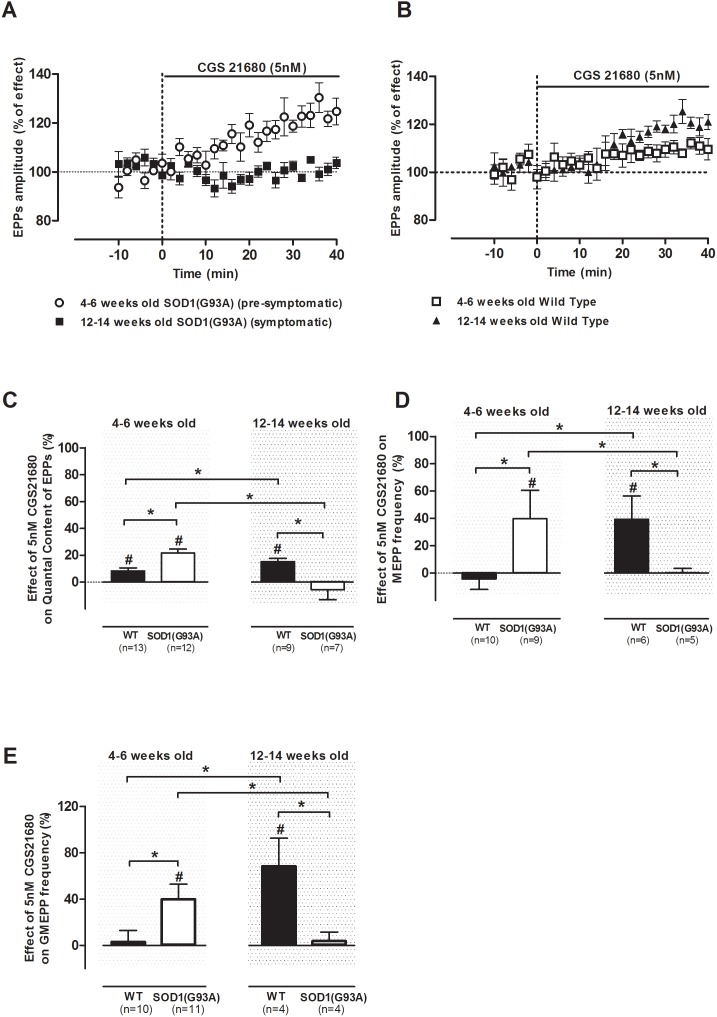
Figure 3. Comparison of A2A receptor function upon disease progression in SOD1(G93A) mice and healthy controls; average time course of mean EPP amplitude facilitation by CGS 21680 (5 nM) in (A) pre-(n = 10) and symptomatic (n = 6) SOD1(G93A) rodents and (B) 4–6 weeks (n = 5) and 12–14 weeks (n = 6) old WT mice; effect of CGS 21680 perfusion at 5 nM on: (C) quantal content of EPPs (4–6 weeks old: n = 13, WT, n = 12, SOD1(G93A); 12–14 weeks old: n = 9, WT, n = 7, SOD1(G93A)); (D) MEPP frequency (4–6 weeks old: n = 10, WT, n = 9, SOD1(G93A); 12–14 weeks old: n = 6, WT, n = 5, SOD1(G93A)); and (E) GMEPP frequency (4–6 weeks old: n = 10, WT, n = 11, SOD1(G93A); 12–14 weeks old: n = 4, WT, n = 4, SOD1(G93A)) in both phases of the study from SOD1(G93A) mice and respective healthy controls; *p<0.05 Unpaired t-test; p<0.05 one-way ANOVA with Tukey’s pos-hoc; #p<0.05 Paired t-test (as compared with control value before drug perfusion); control corresponds to 100% in all cases.

Figure 3