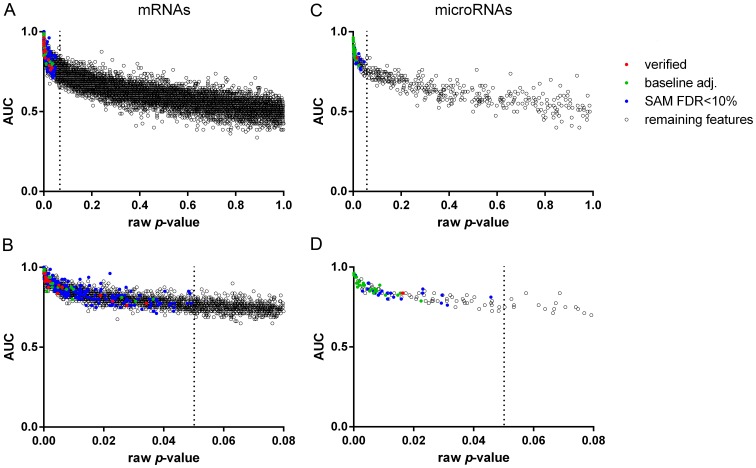
Figure 1. Raw p-values and area under the curve (AUC) of the investigated mRNAs and miRNAs comparing post-TX AKI and PGF allografts.
(A) full p-value range of mRNAs (B) mRNAs with p-value<0.08 on the x-axis for specific visualization of features with a raw p-value<0.05 (C) full p-value range of microRNAs (D) microRNAs with raw p-value<0.08 on the x-axis; red: features verified in an independent dataset (20 mRNAs and two microRNAs), green: significant features after baseline adjustment (39 mRNAs and 29 miRNAs), blue: significant features identified by SAM (245 mRNAs and 49 microRNAs), black: remaining features (11,788 mRNAs and 393 microRNAs).

