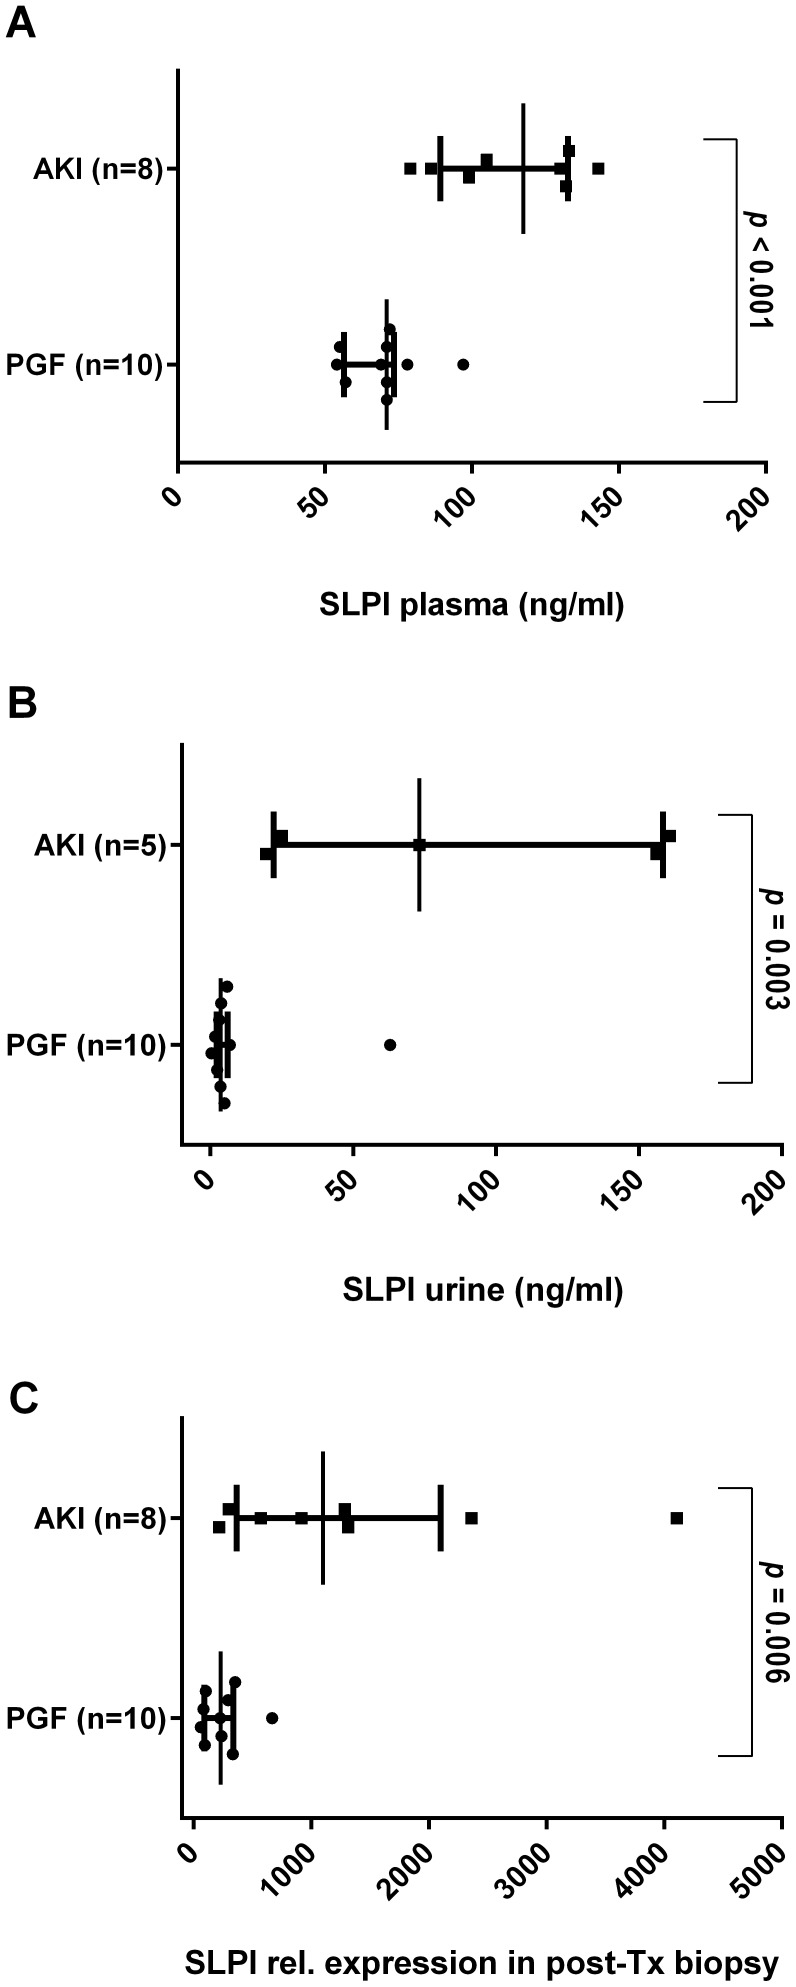
Figure 3. SLPI protein concentration (ng/ml) measured by sandwich ELISA in (A) EDTA-plasma and (B) urine of AKI and PGF patients.
Three AKI patients were anuric at the time of post-TX biopsy. (C) Relative gene expression levels of SLPI in post-TX biopsies. Individual data points as well as median, 1st and 3rd quartile are provided.

