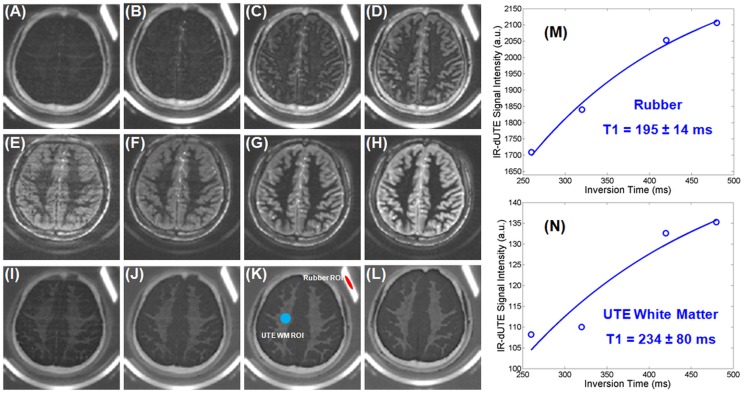
Figure 6. Selected 2D IR-dUTE imaging of a 27 year old healthy volunteer with four different TR/TI combinations: 750/260 ms (A, E, I), 1000/320 ms (B, F, J), 1500/420 ms (C, G, K) and 2000/480 ms (D, H, L).
The ultrashort T2* components were depicted with low signal in the first echo images (A–D), and near zero signal in the 2nd echo images (E–H), but highlighted in the echo subtraction images (I–L). Exponential recovery curve fitting shows a short T1 of 195±14 ms for the rubber, which is about a 7% overestimate relative to the reference value of 182 ms derived from the non-selective saturation recovery UTE acquisitions. A short T1 of 234±80 was demonstrated for the ultrashort T2* components in white matter. A significant fitting standard error was observed.

