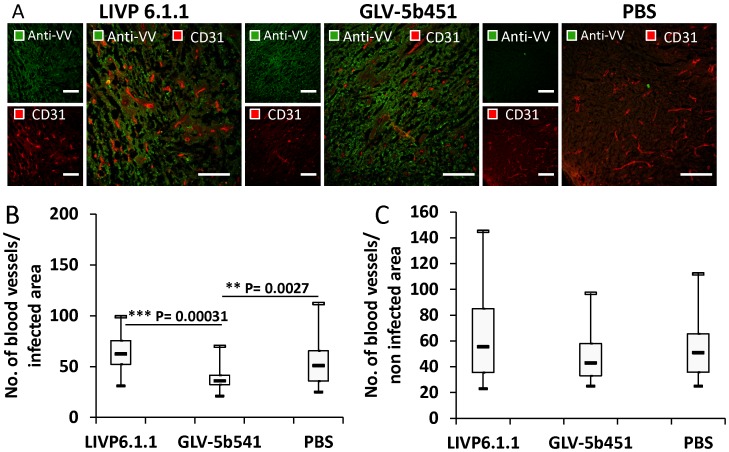
Figure 8. Visualization and determination of vascular density using CD31 immunohistochemistry in virus-treated (LIVP 6.1.1 or GLV-5b451) and PBS-treated tumors at 28 dpvi.
(A) Tumor sections labeled with anti-CD31 antibody (red) and anti-vaccinia virus (VV) antibody (green). Scale bars: 150 µm. (B, C) The vascular density was measured in CD31-labeled tumor cross-sections (n = 3 mice per group, 16 images per mouse) and presented as mean values +/− SD. (***P<0.001, **P<0.01,*P<0.05 Student's t-test).

