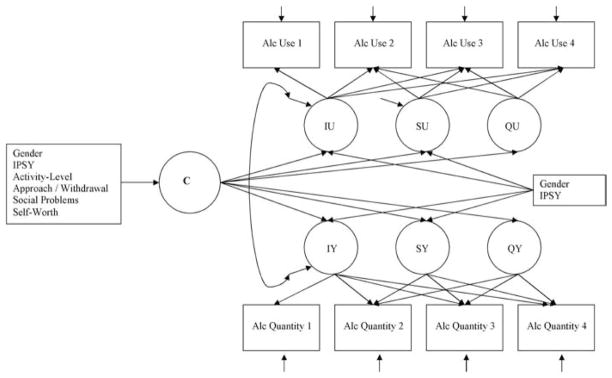
Figure 1.

Path diagram describing the postulated effects of covariates on class membership and growth factors within a two-part latent growth mixture model of alcohol (Alc) use. Top portion of the diagram depicts the prevalence part (u part); the bottom portion depicts the quantity part of the model (y part). C is a latent class variable that influences the growth factors (intercept, linear slope, quadratic slope) of both model parts and is regressed on late childhood risk factors, gender, and intervention. Growth factors (intercept, linear slope) of both model parts are regressed on gender and intervention; however, the intercept of the prevalence part (IU) and the intercept of the quantity part (IY) are not regressed on intervention because of pretest equivalence (cf. Footnote 4). Because we found no effects of intervention and gender on the quadratic slope of the prevalence part (QU) and the quadratic slope of the quantity part (QY), these paths are fixed at zero. Linear and quadratic slope factor loadings for both model parts are fixed at 0, .20, .60, and 1 (linear trend) and 0, .04, .36, and 1 (quadratic trend), taking the uneven spacing between time points into account and representing the average linear and quadratic growth of alcohol use between ages 10.5 and 13. SU = linear slope prevalence part; SY = linear slope quantity part.
