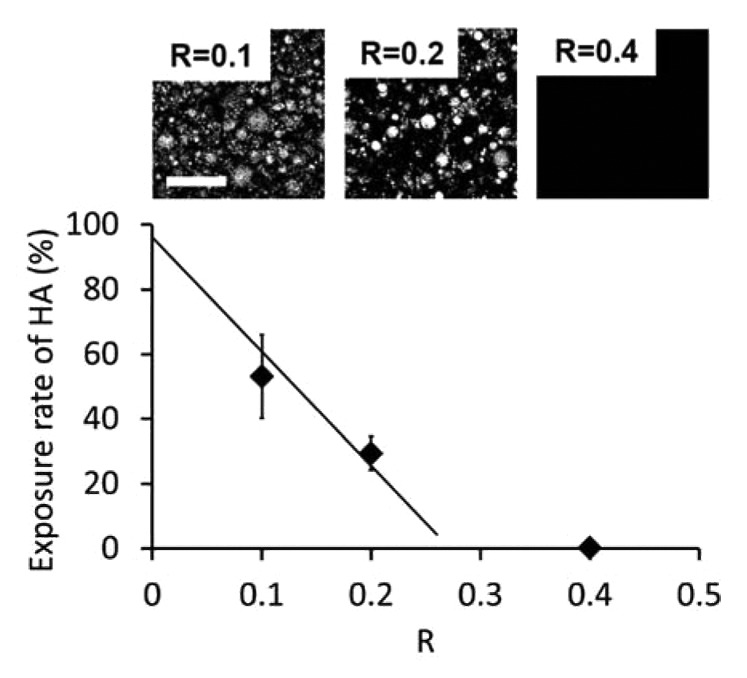
Figure 6. Surface exposure of HA as a function of R. The full line is a linear fit based on data points at R = 0.2 and 0.1, going through full exposure for R = 0. Top images correspond to binarized BSE images used for image analysis. Scale bar is 100 µm.
