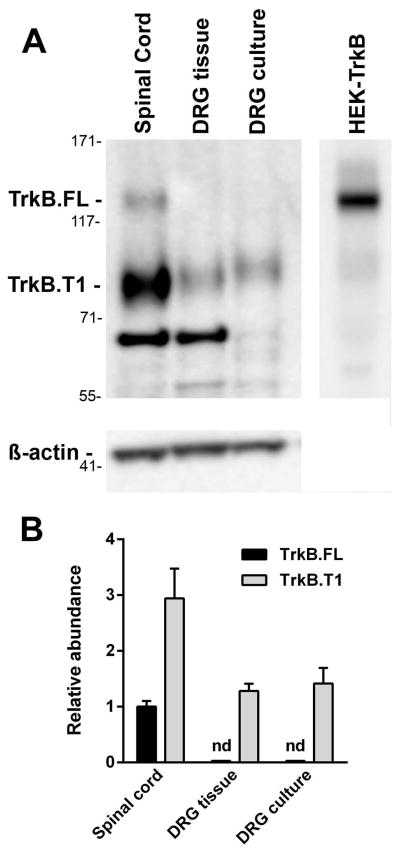
Figure 6.
Expression of trkB.FL and trkB.T1 in DRG and spinal cord. Extracts were prepared from DRG neurons cultured for 3 days and from freshly isolated DRG and spinal cord tissue and Western blots performed. (A) The image shows the results of a representative experiment. Numbers on the left are positions of the molecular weight markers in kDa. Both trkB.FL (extrapolated molecular weight 130 kDa, expected 140 kDa) and trkB.T1 (extrapolated molecular weight 95 kDa, expected 95 kDa) were detected in the spinal cord extract, but only trkB.T1 was detected in DRG tissue and cultured DRG. The band at ~70 kDa in the two tissue extracts was not seen when a different anti-trkB antibody was used and is therefore nonspecific. The last lane was an extract from HEK293 cells transfected with an expression vector for rat trkB.FL. The data were quantified by comparing the relative levels of trkB protein to β-actin. (B) The graph shows this data normalized to the level of trkB.FL in the spinal cord extract (n = 3; nd, not detected).

