
Fig. 10.
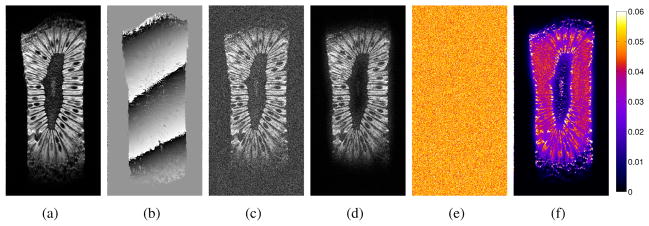
LORAKS denoising of the kiwi fruit dataset. (a) High-SNR magnitude image. (b) High-SNR phase image. (c) Magnitude image generated from the low-SNR simulation with conventional Fourier reconstruction. (d) LORAKS reconstruction using rC = 31, rG = 21, and rS = 70. Also shown are mean-squared error images corresponding to (e) conventional Fourier reconstruction and (f) LORAKS reconstruction with rC = 31, rG = 21, and rS = 70. The colorscale has been normalized such that the grayscale ranges from 0 to 1 for the images in (a–d).