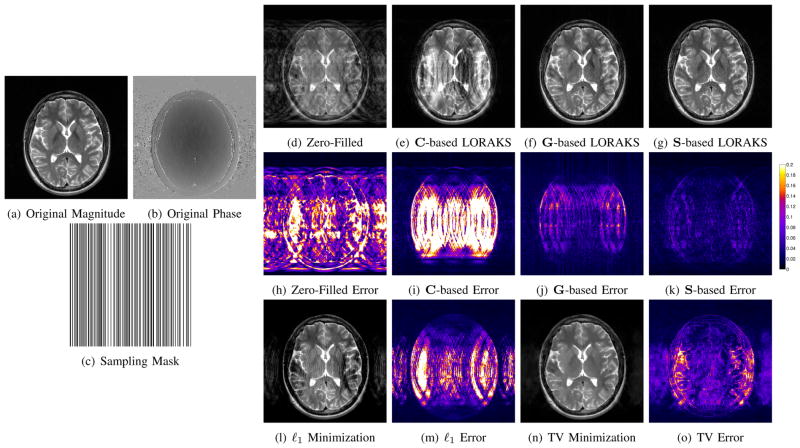
Fig. 12.
LORAKS reconstruction of an undersampled T2-weighted spin-echo brain image of a healthy subject. (a) Magnitude of the fully sampled reference image. (b) Phase of the fully sampled reference image. (c) Random k-space sampling mask. (d) Zero-filled Fourier reconstruction. (e) LORAKS reconstruction with rC = 50. (f) LORAKS reconstruction with rG = 120. (g) LORAKS reconstruction with rS = 70. Note that the reconstructions shown in (f) and (g) still contain small residual aliasing artifacts, which are visible upon close inspection. (h–k) Error images corresponding to the reconstructions shown in (d–g). The colorscale has been normalized such that the grayscale ranges from 0 to 1 for the images in (d–g). For comparison, ℓ1-norm and TV minimization results are shown in (l) and (n), respectively, with corresponding error images shown in (m) and (o).

