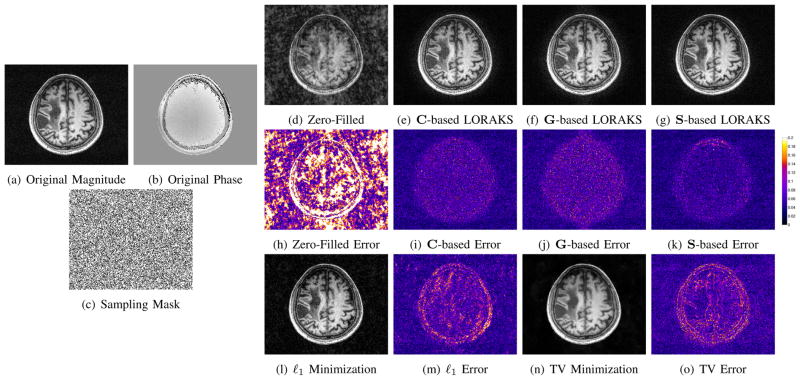
Fig. 14.
LORAKS reconstruction of an undersampled T1-weighted MPRAGE brain image of a patient with a stroke lesion. (a) Magnitude of the fully sampled reference image. (b) Phase of the fully sampled reference image. (c) Random sampling mask. (d) Zero-filled Fourier reconstruction. (e) LORAKS reconstruction with rC = 50. (f) LORAKS reconstruction with rG = 105. (g) LORAKS reconstruction with rS = 75. (h–k) Error images corresponding to the reconstructions shown in (d–g). The colorscale has been normalized such that the grayscale ranges from 0 to 1 for the images in (d–g). For comparison, ℓ1-norm and TV minimization results are shown in (l) and (n), respectively, with corresponding error images shown in (m) and (o).

