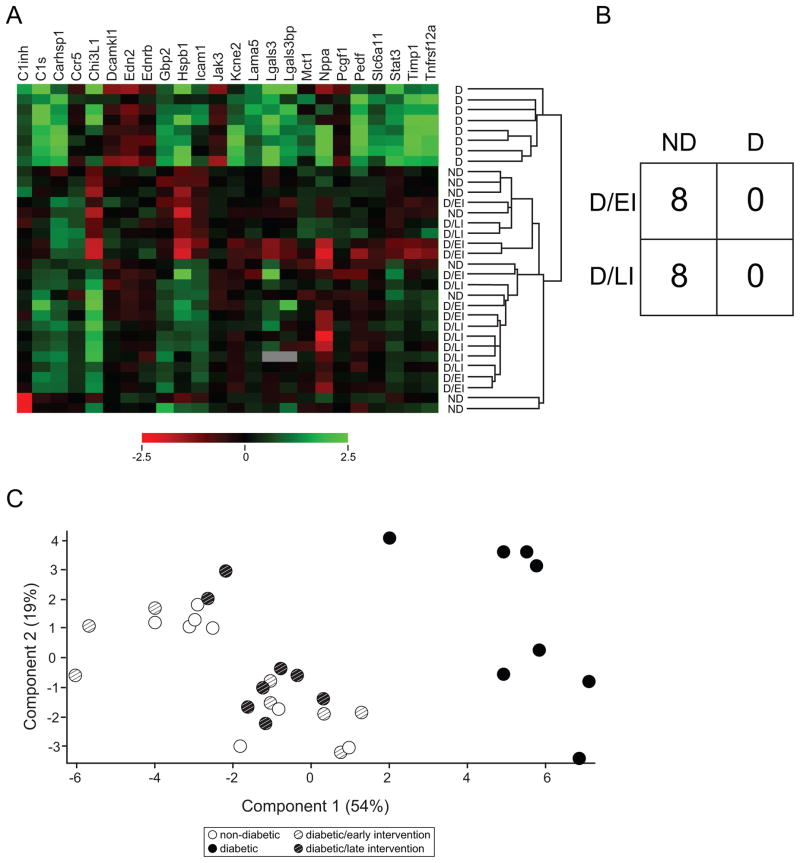
Figure 4. Diabetes-associated retinal gene expression biomarker response to insulin intervention.
Previously we have described diabetes associated retinal gene expression biomarkers and here examined their expression in all groups. As with previous studies, uncontrolled diabetic (D) animals demonstrated significant dysregulation of gene expression compared to non-diabetic (ND) controls. Insulin treated groups, diabetic/early intervention (D/EI) and diabetic/late intervention (D/LI), showed gene expression normalized to ND control levels. As presented in a heatmap (A), D animals separated together and away from ND animals. ND and insulin treated D animals (D/EI and D/LI animals) were intermixed. B) To assess more empirically if insulin treated D animals had a gene expression profile more like ND or D a support vector machine algorithm was used to generate a classification pattern for ND and D. When D/EI and D/LI animals were subsequently tested against the pattern all insulin treated diabetic animals were classified as having a ND pattern. C) When visualized by a principal components plot using the biomarker data, the D animals (each spot represents an individual animal) separated from the animals in the other groups, Cohort 1 (n=8/group).

