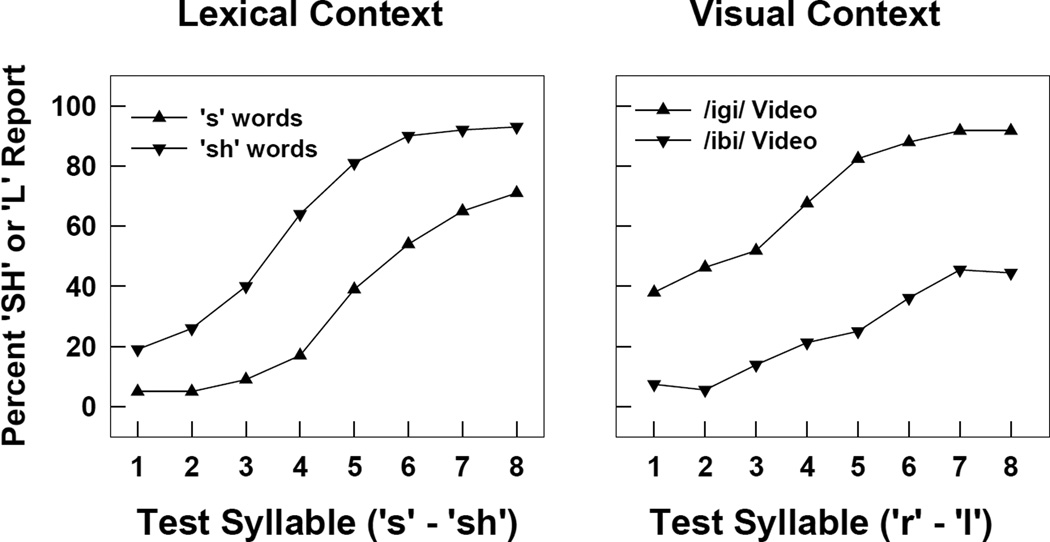
Figure 2.
Left Panel: Identification of test items, adapted from Pitt and Samuel (2006). The x-axis represents the eight test items, with stimulus 1 being most like /Is/ (“iss”) and stimulus 8 being most like /I∫/ (“ish”). Right panel: Identification of the /ili/ - /iri/ test items in Experiment 2a. The x-axis represents the eight test items, with stimulus 1 being most like /r/, and 8 being most like /l/.

