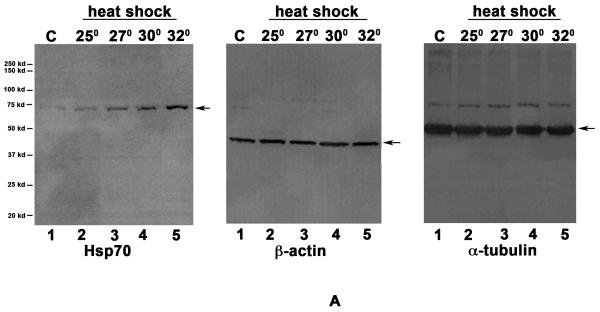
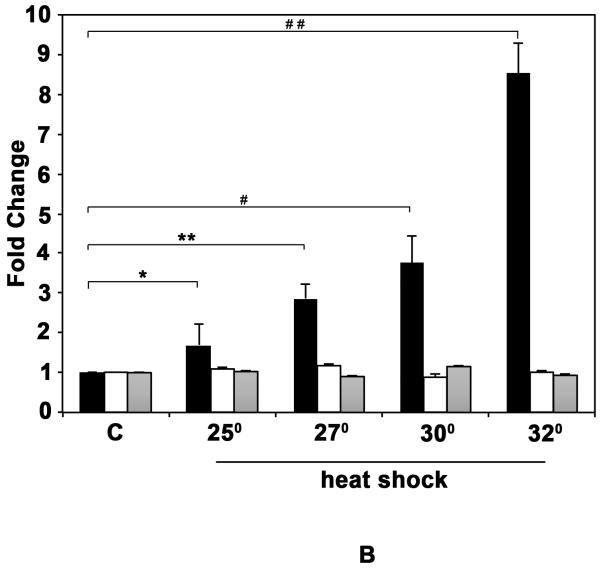
Fig. 1. Induction of Hsp70 in D. pulicaria in response to heat shock.
A. Western blot: D. pulicaria (lake XVI-clone11) were subjected to heat shock at indicated temperatures for 30 minutes and allowed to recover for 4h. Western Blot analysis was performed using 50 μg of total protein using anti-Hsp70 antibody. C lanes indicate control samples with no heat shock treatment. The blot was re-probed with anti-β actin and anti-α tubulin antibodies to ensure equal amounts of protein were loaded in each lane. The positions of molecular weight markers are as indicated on the left. The arrows indicate bands corresponding to Hsp70, β-actin, and α-tubulin. The antibody used in each panel is indicated at the bottom of the blot. B: Quantification of western blot data: The chemifluorescent band intensities were quantified using STORM phosphorimager and the averages from 4 independent biological replicates is represented as a bar graph and the error bars represent standard deviations. Fold-changes are calculated with respect to signals in control lanes. The black bars represent Hsp70, the white bars represent β-actin, and the grey bars represent α-tubulin bands. As shown above bars, *, * *, #, and # # symbols indicate P values that indicate a significant difference (0.0019, 0.0009, 0.0008, and 0.0007 resp.). There was no significant difference observed in signals from β-actin or α-tubulin bands in various lanes with significant values being < 0.01.


