Fig. 2.
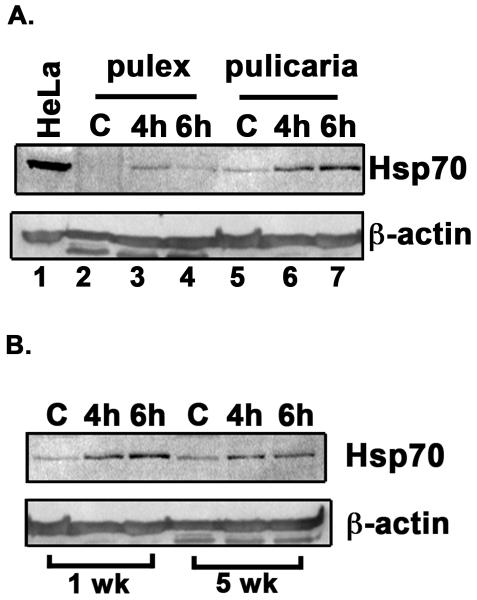
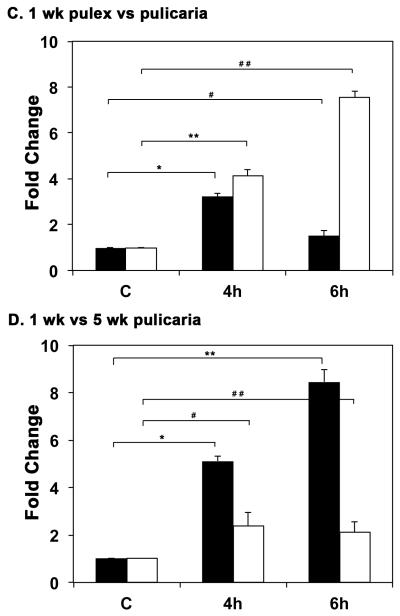
A. Comparison of HSR in D. pulex and D. pulicaria. One week old D. pulex (TCO) and D. pulicaria (lake XVI-clone11) were subjected to heat shock at 32° C for 30 minutes, extracts were prepared after 4h or 6h recovery period. Western Blot analysis was performed using 50 μg of total protein with anti-Hsp70 antibody. The source of the extract and recovery periods after heat shock are as indicated above each lane. C indicates control extract from organisms that were not subjected to heat shock. HeLa extract from heat-shocked cells was used as a positive control for Hsp70. The blot was re-probed with anti-β actin antibody to ensure equal loading. B. Comparison of HSR in young versus old D. pulicaria. One and five week old D. pulicaria (lake XVI-clone11) were subjected to heat shock at 32° C for 30 minutes, allowed to recover for indicated time periods, and protein was extracted. Western Blot analysis was performed using 50 μg of total protein with anti-Hsp70 antibody. Lanes C: non-heat shocked control samples, 4h: after 4h recovery period, and 6h: after 6h recovery period. The age of Daphnia is indicated below the lanes. Blot was re-probed with anti-β actin antibody to ensure even loading. C. Quantification of western blot data in Fig. 2 A: The chemifluorescent band intensities were quantified using STORM phosphorimager and the averages from 5 independent biological replicates is represented as a bar graph and the error bars represent standard deviations. Fold-changes are calculated with respect to signals in control lanes and all Hsp70 signals were normalized to band intensities of β-actin in each lane. The black bars represent D. pulex, and the white bars represent D. pulicaria. As shown above bars, *, * *, #, and # # symbols indicate P values that indicate a significant difference (0.0009, 0.0007, 0.0018, and 0.0008 resp.). There was no significant difference observed in signals for β-actin in various lanes with significant values being < 0.01. D. Quantification of western blot data in Fig. 2 B: The chemifluorescent band intensities were quantified using STORM phosphorimager and the averages from 3 independent biological replicates is represented as a bar graph and the error bars represent standard deviations. Fold-changes are calculated with respect to signals in control lanes and all Hsp70 signals were normalized to band intensities of β-actin in each lane. The black bars represent samples from 1 wk old D. pulicaria, and the white bars represent samples from 5 wk old D. pulicaria. As shown above bars, *, #, * *, and # # symbols indicate P values that indicate a significant difference (0.0013, 0.0027, 0.0018, and 0.0038 resp.). There was no significant difference observed in signals for β-actin in various lanes with significant values being < 0.01.


