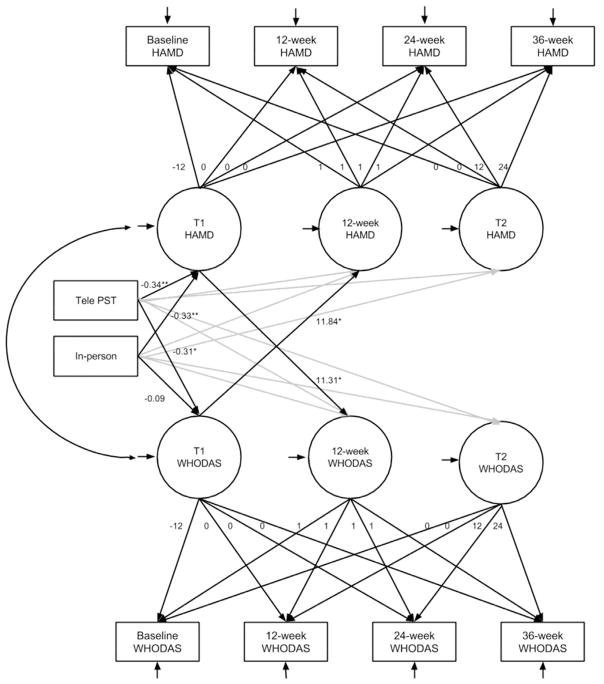
Figure 3.
Parallel-process latent growth curve mediation model.
Note. Gray paths indicate paths included in the model; coefficients are not displayed in order to simplify the figure.
Notations within circles: T1 HAMD and T1 WHODAS: score changes from baseline to 12 weeks; 12-week HAMD and 12-week WHODAS: intercept at 12 weeks; and T2 HAMD and T2 WHODAS: score changes from 12 to 36 weeks.

